Critical Value – Formula, Definition With Examples
reviewed by Jo-ann Caballes
Updated on February 8, 2026
Welcome to Brighterly, where we simplify even the most complex math concepts! Today, we’re exploring statistics and the concept of critical value.
Critical value is a fundamental cornerstone in statistics and is used in hypothesis tests to decide whether an observed effect or result is statistically significant.
We’ll cover the critical value definition, different types of critical values, how it differs from test statistics, and finding critical values using a critical value formula. We’ll also give you practice test questions and cool math worksheets so you can practice your knowledge!
What is the critical value?
A critical value equation is used in a hypothesis test in statistics. In hypothesis tests, we compare two items: a test statistic and a critical value. We reject the null hypothesis if the test statistic is more extreme than the critical value.
Let’s use an example and say Brighterly tutors are testing a new teaching method. Our hypothesis is that it’ll improve students’ math scores. By comparing the average scores of students who use this new method (the test statistic) to a critical value, we can understand if it’s effective. In this case, if the average scores are much higher, we can conclude the teaching method is effective. That is a significant result.
Critical value definition
The definition of critical value is a numerical value that determines the cut-off point between rejecting a null hypothesis and failing to reject it. In other words, it can tell us whether an outcome is unusual or significant.


Critical value example
Let’s look at another example. If you’re throwing darts at a target, your critical value is the boundary that separates your bullseye from the rest of the target. If your dart lands outside the boundary, it would be considered unusual or significant.
Critical value confidence interval
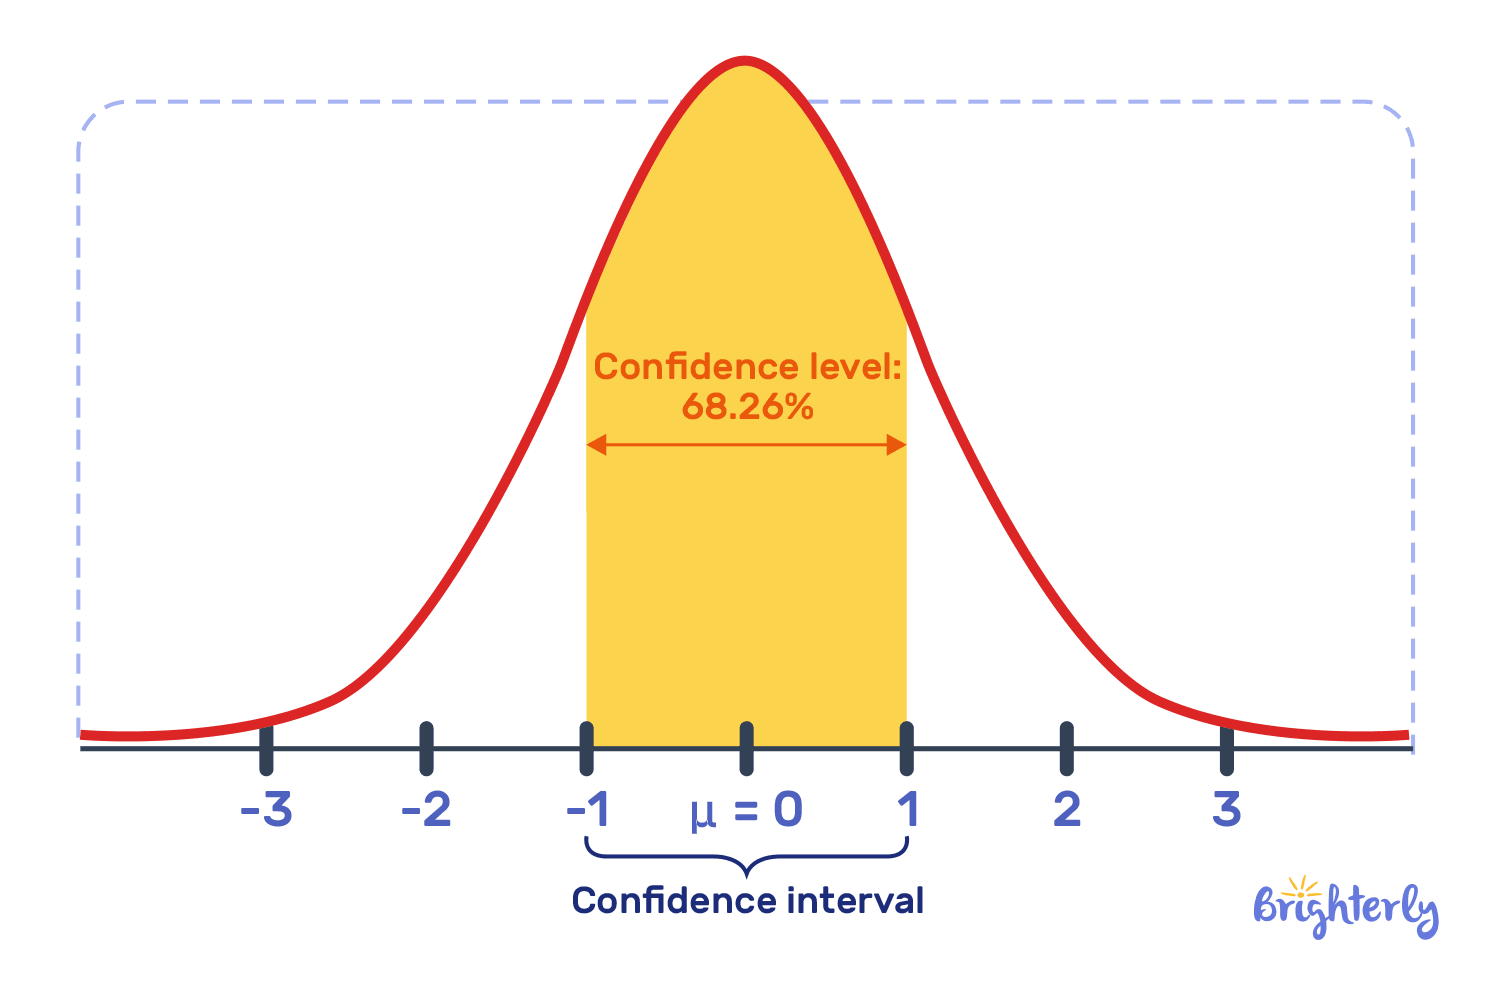
The confidence interval is another key element of hypothesis tests. It`s a range where we expect our mean, or proportion, to be in. For example, if you have a 95% confidence interval, you’re 95% confident your true values lie in that range. The confidence level is chosen first (for example, 95%), and the critical value is then used to calculate the width of the confidence interval.
Z critical value
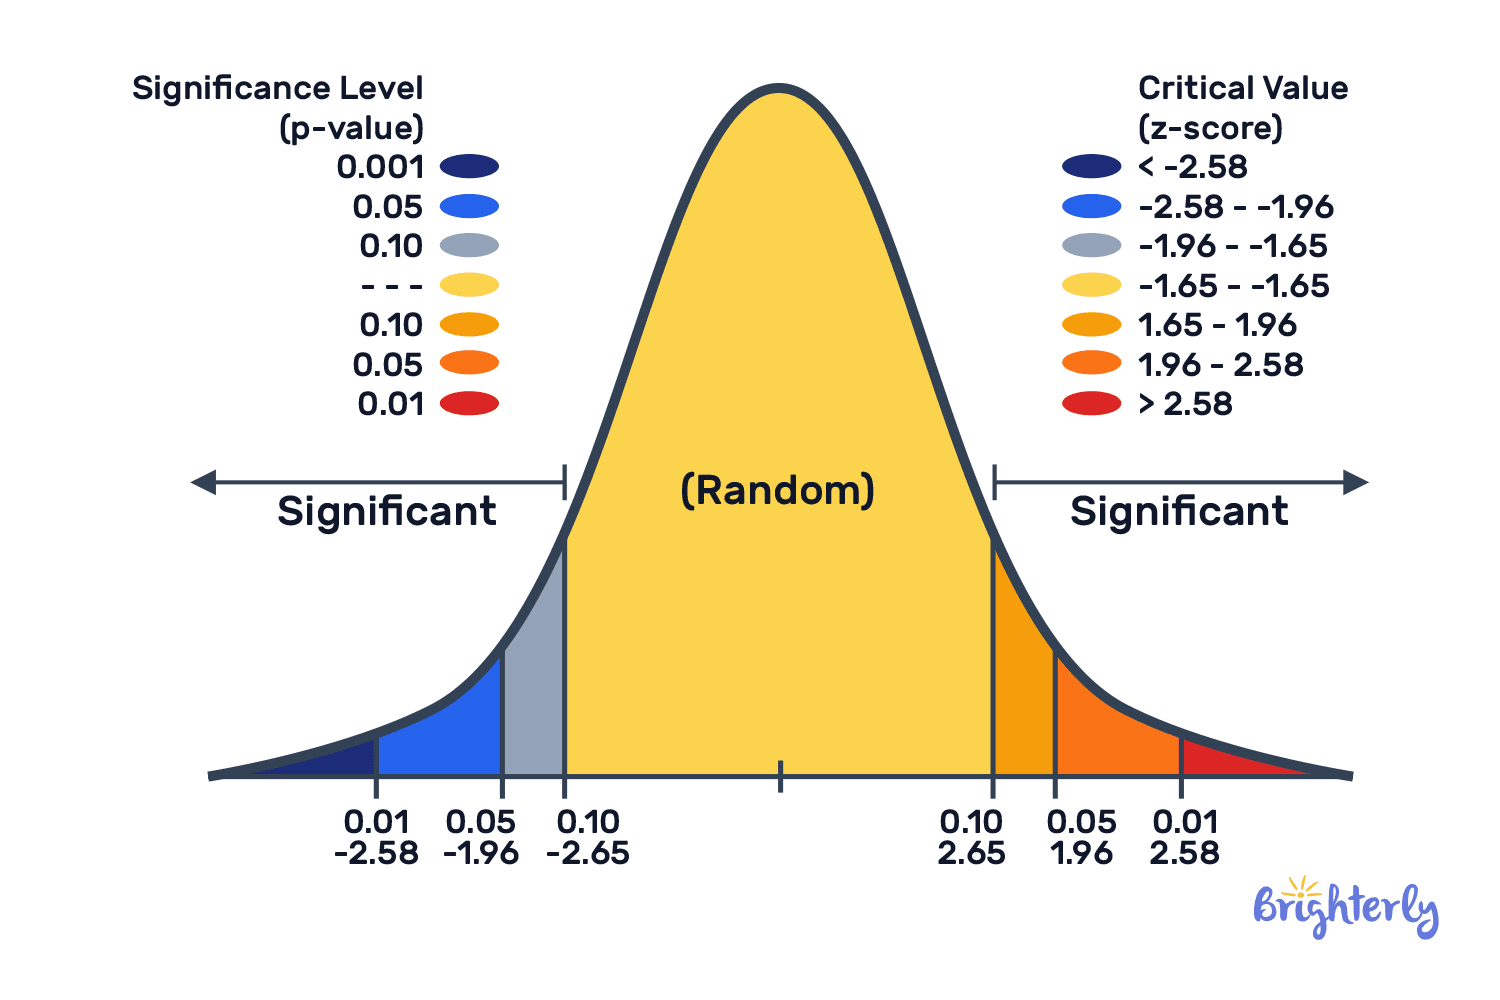
Z critical values are often used for large samples or when the population standard deviation is known. The Z-value is based on the standard distribution, that symmetrical bell curve you’ve probably come across before. Large samples often follow predictable patterns, and because of this, Z-values are standardized (e.g. in the case of 95% confidence interval, the critical Z value is 1.96). You can find these numbers in the Z critical value table, and they can help you decide if your findings are significant or not.
 \
\
T critical value
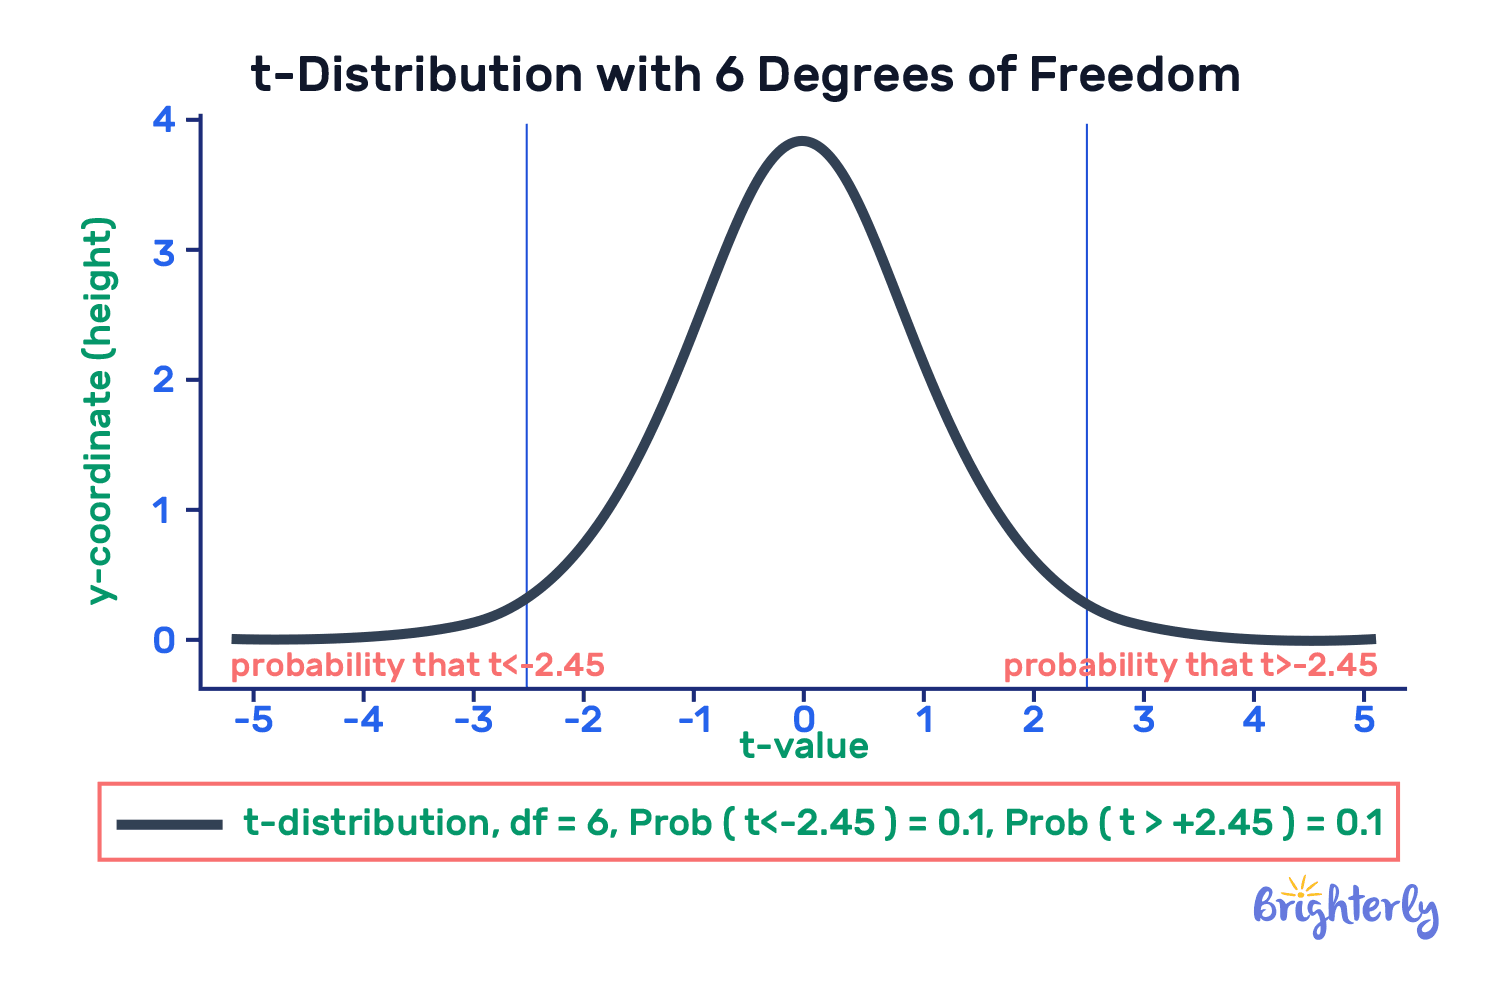
When your sample size is small or you don’t know the exact spread of the entire population, your best way to go is the T critical value. It uses the T-distribution, which looks like a bell curve but has “thicker” ends to account for the larger levels of uncertainty that come with smaller groups. Because smaller samples can be a bit more unpredictable, based on your specific sample size, the critical T value will change. To see if your results are significant, depending on your degrees of freedom (which in statistics means your sample size minus one), you would use a T table of critical values or in a T critical value calculator.
F critical value
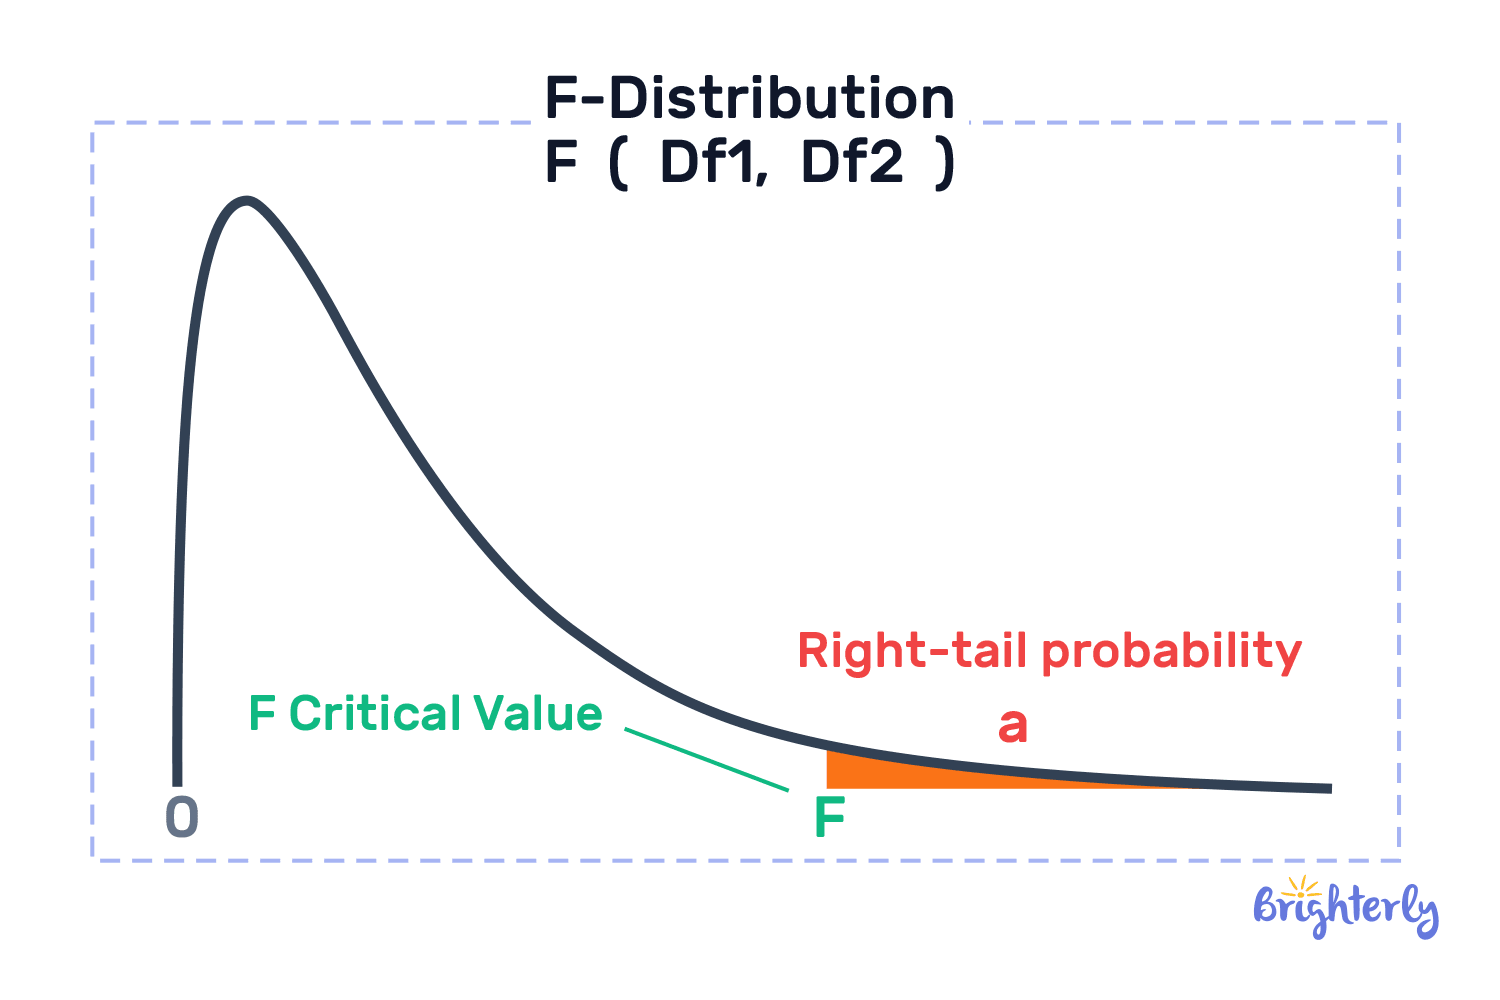
F critical value is a bit more specialized. F critical values are used in tests like ANOVA to compare variability between groups and determine whether differences are statistically significant. Here, instead of just looking at the average, it helps you understand if there is a significant difference among multiple sets of data that you have. As a result, the F critical value table is more complex than the table of common critical values of other values. As it can help you juggle more information from different groups, the F-value is essential if you want to solve problems where many variables are at play.
Definition of critical value in statistics
In statistics, we define a critical value as the numerical value at which we decide whether to accept or reject the null hypothesis. You can think of it as some sort of line or a threshold.
Test statistic vs critical value
Test statistics and critical value are both used in hypothesis tests. You need them both to decide whether to accept your null hypothesis or reject it, so in some ways, there are two sides of the same coin. With that being said, they are also very different entities.
In hypothesis testing, the test statistic and the critical value are the two primary components we use to determine whether or not to reject a null hypothesis.
The test statistic is the numerical value that you calculate using your sample data during a hypothesis test. This is the number that measures how far your results diverge from what would be expected under the null hypothesis. The z-scores, t-scores, and f-statistics we discussed earlier in the article are all examples of a test statistic. In fact, you can even think of the test statistic as an umbrella term for all these methodologies.
In contrast, the critical value is a threshold or benchmark that you set before looking at your data. The critical value is determined by the boundary of the rejection region on a probability distribution curve, and is based on the significance level you chose. In other words, it’s the number you compare your test statistics against to prove that your results aren’t just a product of random chance.
At the end, you compare the two. If the absolute value of your test statistic is larger than the critical value, you reject the null hypothesis. If it is smaller, you fail to reject it.
Difference between critical value and test statistic
The critical value and test statistic are both important when it comes to hypothesis testing, but they are different. Our critical value is predefined and determines at what point we reject our null hypothesis. Our test statistic, meanwhile, is based on our sample data. This is how we distinguish critical value from test statistic.
Formulas for critical values
When finding critical values, you can’t just use a single formula for everything. Instead, the best formula will depend on the data you have, as well as your sample size. These formulas will help you find the exact cutoff point on a graph that tells you if your results are meaningful or just a lucky guess. Let’s look at the formulas.
- If you are working with a large group of data, the formula you would use is the Z critical value. For a simple one-tailed test, you will need to find the spot on the graph that matches 1 – alpha. The formula would be Zc = Z(1-a). For a two-tailed test, the formula becomes Zc = Z(1-a/2), as you split the risk between the two tails.
- The next formula, the T critical formula, is better for smaller groups of data. T critical value depends on your degrees of freedom, and because of this, it’s a bit more flexible than the Z value. The formula of T-critical value would then be written as T=T(df,1−α/2).
If you are looking at how to find critical values easily, you can use the critical value calculator, which will give you the critical values for left-tailed, right-tailed, and two-tailed distributions in a single click.
Understanding the formula for calculating critical value
Depending on the type of hypothetical test you’re doing, you’ll use different methods of calculating critical value:
- T-tests: you’ll use the degrees of freedom (df – related to your sample size) and your identified significance level to calculate the critical value. These come from your t-table
- Z-tests: you’ll use a Z-table to calculate the critical value. This table shows you the relationships between your Z-scores and percentages
Writing the formula for critical values
Writing your formula for critical value will vary depending on the statistical test you use. If you’re using a T-test, your formula can be written as T = T(df, 1-α/2). Here, α is your chosen significance level and df is the degrees of freedom.
If you’re using a Z-test, your critical value formula can be written as Z = Z(1-α/2) for a two-tailed test, where α is your chosen significance level.
How to find critical value?
Let’s now look at how to get the critical value. For this, you need to first identify the significance level (usually a = 0.05) and the type of distribution your data follows (It can be Z, T, or F, as we discussed earlier). If you use Z or T critical value formula, you also need the degrees of freedom based on your sample size. You can look up these parameters in critical value statistics tables or calculators.
Solved math tasks: examples
Ready to test your knowledge on critical value? Try out our solved math problems below!
Solved math task 1
You need to create a 95% confidence interval for a population mean using a sample size of 50. You know the population standard deviation is 10. What is the z critical value?
Answer:
| 1.96. |
With a 95% confidence level, the standard z critical value is 1.96.
Solved math task 2
You have 25 apples and you want to see if their average weight is 150 grams. You’ve given a standard deviation of 20 grams. Find the t critical value with a 95% confidence level in a two-tailed test.
Answer:
| Approximately 2.064. |
For a two-tailed test at a 95% confidence level with 24 degrees of freedom, using the t critical formula, the t critical value from the T-table is approximately 2.064. You can use a t critical value calculator to work this out.
Critical value: practice math problems
Critical value worksheets
Now that you know how to calculate critical value and what it is in statistics, you can dive deeper into statistics with our free supporting math worksheets.
Frequently asked questions on critical values
What is a critical value?
A critical value is a value we use in hypothetical tests to establish the lower and upper bounds of our confidence intervals. It is the cut-off point for data that we deem statistically relevant in our test and it determines whether we reject or accept our hypotheses.
How to find T critical value?
To find a t-critical value, identify your significance level (a, alpha) and calculate the degrees of freedom (df = n – 1). Find where these two values intersect on a T-distribution table, or use an online calculator to find the cutoff point for your specific sample size.
How to find Z critical value?
To find a Z critical value, again, you need to determine your significance level and whether the test is one-tailed or two-tailed. Then, look up the area under the curve in a standard normal Z table to find the Z-score that marks your rejection boundary.
What is a critical value in statistics?
A critical value is a mathematical line in the sand in hypothesis testing. It is the threshold that separates usual results from statistically significant ones. If your test result is bigger than this value, you reject the null hypothesis in favor of your theory.


Math & reading from 1st to 9th grade
Looking for homework support for your child?

Choose kid's grade
Math & Reading for Grades 1–9
Build real confidence for your child with a Brighterly math or reading tutor.