Binomial Probability Worksheets
Updated on September 4, 2026
Binomial probability worksheets give students structured practice identifying the four characteristics of a binomial experiment — fixed number of trials, independent observations, exactly two possible outcomes, and constant probability of success — and calculating exact and cumulative probabilities using the formula P(X=k) = C(n,k)·p^k·(1−p)^(n−k). Students also find the mean and variance of binomial distribution problems involving coins, quality control scenarios, and repeated Bernoulli trials. Students who find it difficult to distinguish when the binomial formula applies versus when to use a normal approximation or geometric distribution will build much clearer intuition by working through boundary cases with high school math tutors who specialize in advanced statistics.
Download Binomial Probability Worksheet PDFs
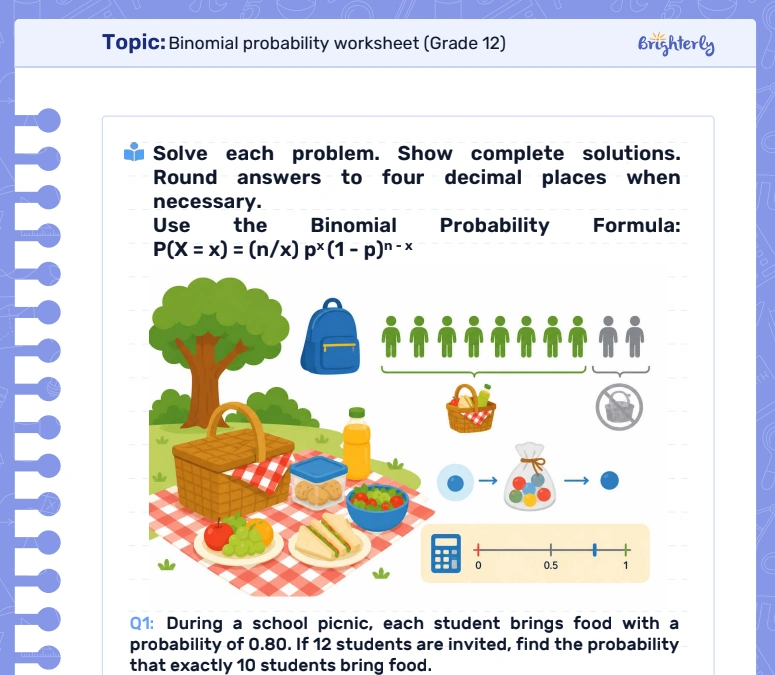
Access our collection of high-quality, printable resources to strengthen your understanding of binomial experiments, probability mass functions, and distribution statistics.
More probability and statistics worksheets
Expand your probability reasoning with these related resources covering compound probability, multi-event models, statistical measures, and foundational algebraic techniques for distribution calculations.
- 7th grade probability worksheets
- probability of compound events worksheets
- mean median mode and range worksheets
- algebra 2 worksheets
- algebra worksheets


Help your child reach their full potential!
Answer a few quick questions about your child’s learning, and we’ll recommend next steps.
Benefits of Binomial Probability Worksheets
Binomial probability worksheets develop the ability to model discrete random events with exactly two possible outcomes — a framework that appears in quality control, medical testing, polling, and game theory. Students practice applying the binomial formula systematically, computing the binomial coefficient C(n,k) using Pascal’s triangle and the combinatorics formula, and evaluating probability expressions accurately.
Working through problems that require identifying whether an experiment is binomial — checking that trials are independent, outcomes are binary, and probability is constant — builds the categorical reasoning needed for AP Statistics. Students learn that not every two-outcome experiment qualifies, and that misclassifying the distribution type leads to systematic errors.
Calculating cumulative probabilities (P(X ≤ k)) and interpreting them as percentile positions develops statistical literacy: students learn to answer questions like “”what is the probability that at most 3 of 10 trials succeed”” and connect those calculations to the underlying probability distribution table.
These exercises also introduce the mean (μ = np) and variance (σ² = np(1−p)) formulas for the binomial distribution, which bridge computational probability with the descriptive statistics needed for hypothesis testing and confidence intervals in AP Statistics.


Math & reading from 1st to 12th grade
Looking for homework support for your child?

Choose kid's grade

Math & Reading for Grades 1–12
Build real confidence for your child with a Brighterly math or reading tutor.