Solving and Graphing Inequalities Worksheets
Updated on August 26, 2026
These free printable worksheets give grade 6 students practice solving inequalities and graphing their solutions. Each worksheet includes an answer key, so students can check their own results.
Problems range from one-step inequalities to multi-step inequalities that require isolating the variable before graphing the solution. For more algebra practice, explore Brighterly’s algebra worksheets hub.
Solving and Graphing Inequalities Worksheets: Free Download
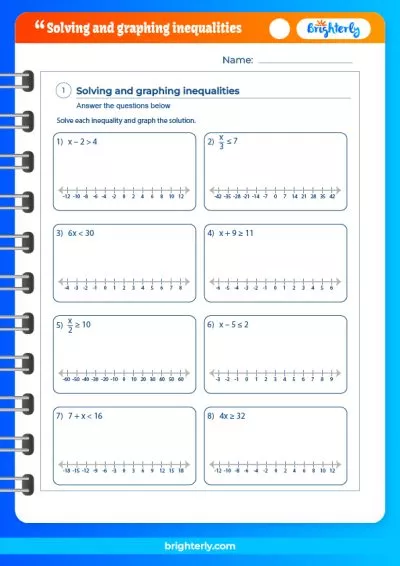
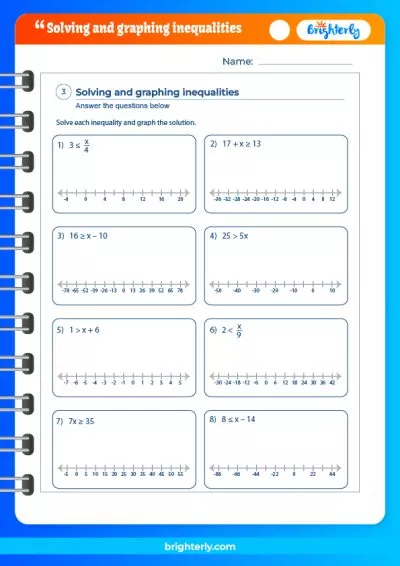
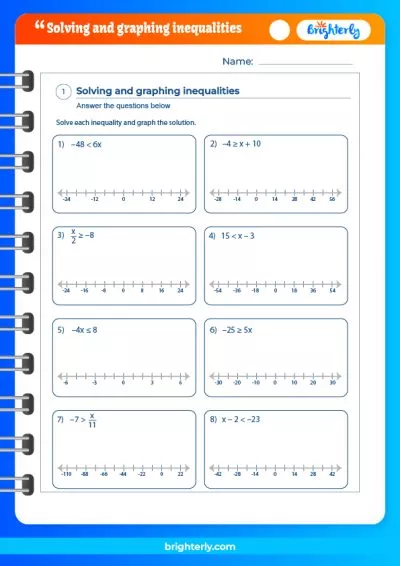
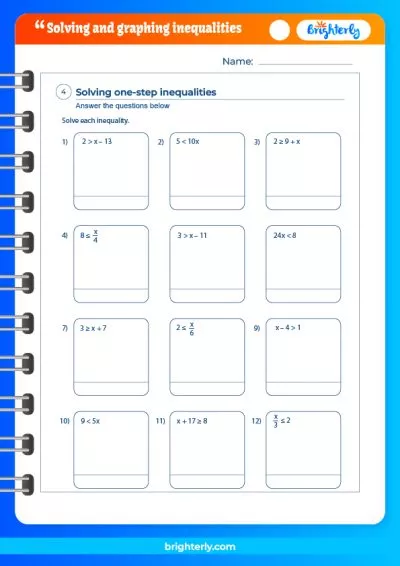
This topic is available as four downloadable worksheet files:
How to Solve an Inequality
To solve an inequality, isolate the variable on one side of the inequality sign using inverse operations — addition, subtraction, multiplication, or division — the same way you would solve an equation.
Worked Example: 2x + 3 < 7
- Subtract 3 from both sides: 2x < 4
- Divide both sides by 2: x < 2
x < 2
How to Graph an Inequality on a Number Line
Once an inequality is solved, its solution can be shown on a number line. Use an open dot for “less than” or “greater than” (< or >), since the boundary number itself is not included. Use a closed, filled-in dot for “less than or equal to” or “greater than or equal to” (≤ or ≥), since the boundary number is included. Then draw an arrow in the direction of every number that satisfies the inequality.
Worked Example: x − 2 > 4
- Add 2 to both sides: x > 6
- Since the inequality is strictly greater than, draw an open dot at 6.
- Draw an arrow to the right of 6, since every number greater than 6 is a solution.
Worked Example: 4x ≥ 32
- Divide both sides by 4: x ≥ 8
- Since the inequality includes “or equal to,” draw a closed dot at 8.
- Draw an arrow to the right of 8, since every number greater than or equal to 8 is a solution.
Graphing Inequalities on a Coordinate Plane
This worksheet focuses on graphing one-variable inequalities on a number line. Once your child is comfortable with that, the next step is graphing two-variable inequalities, such as y < 2x + 1, on a coordinate plane — which works like graphing a line, then shading the entire side of it that contains the solutions. Those Brighterly’s graphing linear inequalities worksheets cover this next step in more depth.
More Algebra Worksheets
Once your child is confident solving and graphing inequalities, explore more of Brighterly’s algebra practice:
- One-Step Inequalities Worksheets
- Two-Step Inequalities Worksheets
- Compound Inequalities Worksheets
- Graphing Inequalities on a Number Line Worksheets
- Graphing Linear Inequalities Worksheets
- Number Line Worksheets
- Solving Equations Worksheets
- Systems of Linear Inequalities Worksheet
What Kids Practice With These Solving and Graphing Inequalities Worksheets
- Isolating the variable using inverse operations
- Solving one-step and multi-step inequalities
- Graphing inequality solutions on a number line
- Using open and closed dots to show strict versus inclusive inequalities
- Checking work against an included answer key
Each worksheet includes an answer key, so students can check their own results without waiting for a teacher to grade the page. Practicing both the solving steps and the graphing conventions together helps students see an inequality’s solution as a range of numbers, not just a single answer.


Help your child reach their full potential!
Answer a few quick questions about your child’s learning, and we’ll recommend next steps.
FAQ
How do you solve an inequality?
Solving an inequality works much like solving an equation: isolate the variable on one side using inverse operations such as addition, subtraction, multiplication, or division. The one key difference is that multiplying or dividing both sides by a negative number flips the direction of the inequality sign, which is easy to forget but important to check.
How do you graph an inequality on a number line?
First solve the inequality so the variable is alone on one side. Then plot a dot at the boundary number and draw an arrow showing every number that satisfies the inequality — to the right for “greater than” and to the left for “less than.” Whether the dot is open or closed depends on whether the boundary number itself is included.
What’s the difference between an open dot and a closed dot when graphing an inequality?
An open dot means the boundary number is not part of the solution, which is used for strict inequalities like “less than” or “greater than.” A closed, filled-in dot means the boundary number is included, which is used for “less than or equal to” or “greater than or equal to.” The arrow direction stays the same either way.
What grade is this solving and graphing inequalities worksheet for?
This worksheet is written for grade 6 students who are building on earlier equation-solving skills learned in previous grades. Problems include one-step and multi-step inequalities that require isolating the variable before graphing the solution, matching the level where most sixth graders are first introduced to inequalities and their number-line graphs in class.
Does this worksheet include an answer key?
Yes, this worksheet includes an answer key showing both the solved inequality and its graph on a number line. Students can check their own results as soon as they finish a problem, which helps them catch mistakes in an inverse-operation step or a graphing detail right away, instead of waiting for a teacher to grade the assignment.


Problems with Inequalities?
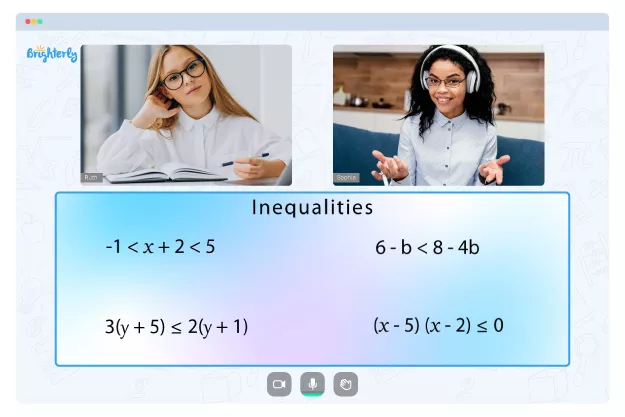
- Does your child need additional support with understanding inequalities?
- Start lessons with an online tutor.
Choose kid's grade

Is your child finding it challenging to master inequalities? An online tutor could be the answer.
Book FREE lesson