Child Literacy Statistics United States 2026
reviewed by Franz Jerby Delos Santos
Updated on November 3, 2025
Having worked with young learners for years, I still found the latest child literacy statistics in the United States eye-opening. Nearly two-thirds of students struggle to read at grade level! You’d probably be surprised as well when you learn about state differences, racial disparities, and income gaps.
Key stats
- 4th grade: 31% at or above Proficient; 40% below Basic.
- 8th grade: 30% at or above Proficient; 33% below Basic.
- Lowest-performing states: New Mexico, Louisiana, and Mississippi.
- Below-Basic readers disproportionately contribute to high school dropout statistics (60% of non-graduates).
- Children in poverty are 3x more likely to drop out. If combined with poor reading, it is 6x more likely.
- Early home reading correlates with higher literacy proficiency later, and Brighterly can help with that.
Child literacy statistics United States
Recent data from NAEP shows troubling trends:
- Proficiency rates are dropping. Only 31% of fourth-graders and 30% of eighth-grade students performed at or above the NAEP Proficient level.
- Increased below-Basic levels: 40% of fourth- and 33% of eighth-graders scored below the NAEP Basic level.
- Reading performance differs a lot from state to state.
- Racial and socioeconomic disparities. 60% of Black eighth-graders and 54% of Hispanic ones scored below the Basic level.
And that’s despite decades of educational initiatives. Plus, COVID-19 caused a significant pandemic learning loss.
The good news is that sites like Brighterly math and reading platform actually can help. Heard of appropriate personalized reading assessments or guided tutoring?
Let Brighterly help your child avoid illiteracy statistics
Reading at home early on really helps kids develop literacy skills. Children who engage in regular reading and storytelling with family members tend to perform better in reading assessments.
Start with reading worksheets for kids. They’re specifically developed for children from 1st to 9th grade. You’ll find a whole diversity of activity types – all collected based on the kids’ grades.


Check the basics behind this term
Take our quick quiz to discover the perfect learning solution based on your child’s needs.
What is the child literacy rate in the United States?
31% of fourth-grade students scored at or above the NAEP Proficient level, which indicates solid academic performance and competency. 60% of fourth-grade students performed at or above the NAEP Basic level (means partial mastery of foundational skills).
Note: The United States doesn’t have a clear child literacy rate. Literacy is tracked by proficiency levels, not just basic reading ability. However, the most reliable and complete data comes from the National Assessment of Educational Progress (NAEP), often called The Nation’s Report Card.
Child literacy rates by state
In 2024, only 31% of fourth-grade students nationwide scored at or above the NAEP Proficient level in reading. That’s a 2-point drop from 2022 and 4 points lower than 2019. Even more concerning, 40% of fourth-graders scored below the NAEP Basic level in 2024. Unfortunately, it’s the highest percentage since NAEP started tracking child literacy statistics in 1992.
Here’s a brief summary of the U.S. literacy rate by state:
Top-performing states |
||
State |
Literacy statistics on 4th-grade reading proficiency (NAEP 2024) |
More context |
| Massachusetts | ~40-48% |
comes in first with most of the children reading at or above grade level (overall performance) |
| Maryland | High range (35-40%) | One of the top 3 states for childhood literacy statistics |
| New Hampshire | High range (35-40%) |
Has the third-highest child literacy rate; it also has the |
| Florida | 33% | Leads all Southern states in 4th grade reading proficiency |
Lowest-performing states |
||
State |
Statistics about literacy |
|
| New Mexico | According to the National Literacy Institute, it’s the lowest child literacy rate in the country + most shocking illiteracy statistics | |
| Louisiana | One of the bottom three states, the adult literacy rate is 84% | |
| Mississippi | Ranks in the bottom 3 for child literacy; 84% adult literacy rate | |
Child literacy statistics United States by year
- U.S. literacy rate by year: 2019 – 2020
- Literacy rates in the US over time: 2021 – 2023
- Child U.S. literacy rate 2024 – 2025
Child literacy statistics United States 2019 – 2020
Fourth-grade reading performance (2019) |
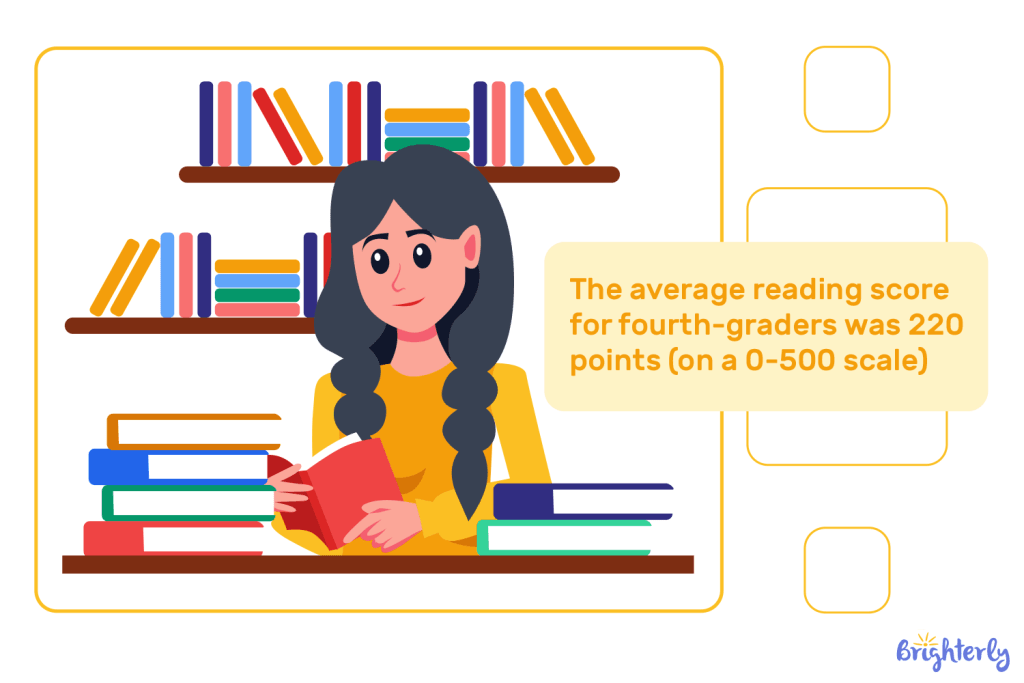
In 2019, NAEP revealed concerning trends in child literacy rates across the United States: – The average reading score for fourth-graders was 219 points (on a 0-500 scale) – Only 34% of fourth-grade students nationwide scored at or above the NAEP Proficient level in reading in 2019, down from 35% in 2017. Besides, it means that approximately 66% of fourth-graders weren’t reading at grade level. This statistic was also confirmed by the ‘Kids Count’ (2020) from the Annie E. Casey Foundation. – In addition, 35% of fourth-graders scored below the NAEP Basic level in 2019, meaning more than one-third of students didn’t have the basic reading skills for their grade level. |
Eighth-grade reading performance (2019) |
Other findings of the Nation’s Report Card claim the following: – The average literacy rate for eighth-graders dropped by three points between 2017 and 2019, falling from 267 to 263. – Only 37% scored at or above NAEP Proficient in 2019. In other words, 63% of eighth-graders were not reading proficiently. According to NCES Associate Commissioner Peggy G. Carr, ‘Over the past decade, there has been no progress in either mathematics or reading performance, and the lowest performing students are doing worse.’ |
Child literacy statistics United States 2021 – 2023
The October 2022 release of NAEP scores for fourth and eighth-graders showed major learning setbacks across all grade levels:
Fourth-grade reading (2022) |
|
Eighth-grade reading (2022) |
|
The pandemic’s severe impact: 2021-2022The 2021-2022 literacy rates US showed the true extent of learning loss from the pandemic in child literacy across America. In September 2022, the NAEP released long-term trend data for 9-year-olds that shocked education experts nationwide. |
|
Reading results (9-year-olds) |
|
Mathematics results (9-year-olds) |
|
According to Peggy Carr, Commissioner of the National Center for Education Statistics, ‘These are some of the largest declines we have observed in a single assessment cycle in 50 years of the NAEP program. Students in 2022 are performing as they did two decades ago.’
Child U.S. literacy rate 2024 – 2025
As of 2024-2025, the United States is dealing with a continuing literacy crisis among kids. It’s gotten even worse since the COVID-19 pandemic. The latest National Literacy Institute data shows that approximately 64% of fourth-grade students nationwide are not reading proficiently.
Fourth-grade reading performance (NAEP, 2024)
2024 result |
Change vs. 2022 |
Change vs. 2019 |
Historical context |
|
| Average literacy rate (0-500 scale) | 215 | ⬇️ 2 points (from 217) | ⬇️ 5 points (from 220) | Equal to the 1992 level – three decades of progress erased |
| % at or above NAEP Proficient | 31% | ⬇️ 2 pp (from 33%) | ⬇️ 4 pp (from 35%) | ⬇️ 6 pp from 2017 peak (37%) |
| % below NAEP Proficient | 69% | — | — | — |
| % below NAEP Basic | ≈ 40% | — | — | |
| Effects of illiteracy | Many students scoring < Basic can’t identify a reason for a character’s action implied in a story. | |||
Eighth-grade reading performance (NAEP, 2024)
2024 result |
Change vs. 2022 |
Change vs. 2019 |
Historical context |
|
| Average literacy rate (0-500 scale) | 258 | ⬇️ 2 points (from 260) | ⬇️ 5 points (from 263) | — |
| % at or above NAEP Proficient | 30% | — | — | Lowest since 1994 |
| % below NAEP Proficient | 70% | — | — | — |
| % below NAEP Basic | ≈ 33% | |||
| Effects of illiteracy | Students below Basic often lack the knowledge and skills to interpret an author’s argument or understand complex text structures. | |||
Nearly five years after the COVID-19 pandemic began, the country is still behind its 2019 (pre-pandemic) scores in both grades and subjects. As per the Nation’s Report Card, just two states have beaten their pre-pandemic scores in any single grade or subject: Louisiana in fourth-grade reading and Alabama in fourth-grade math.
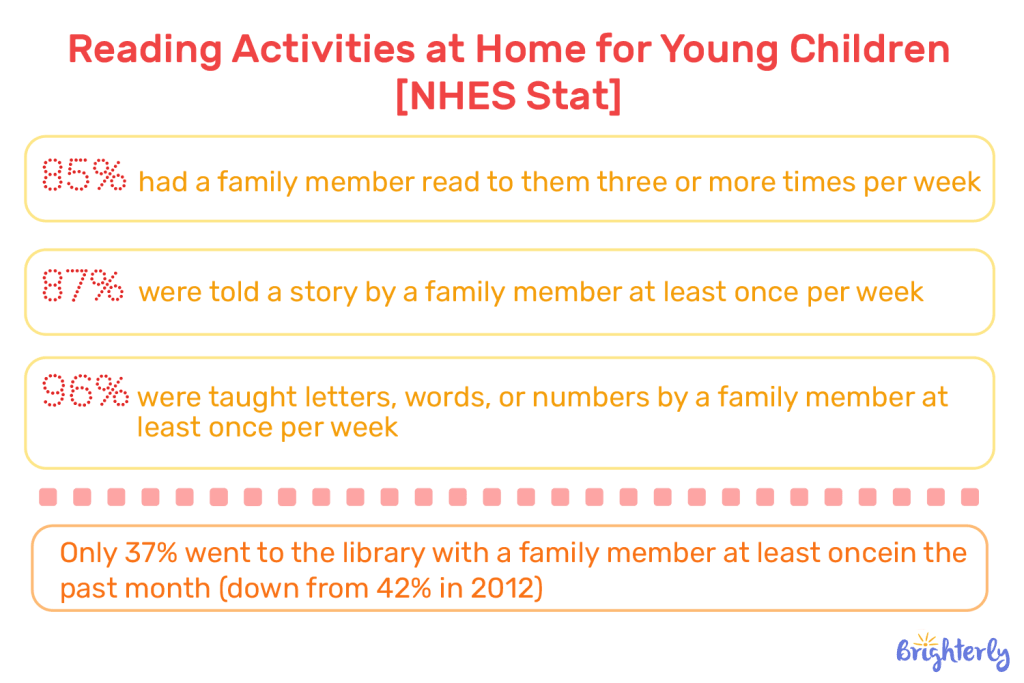
Early literacy statistics on the home environment
The National Household Education Surveys Program (NHES) gave a look at some early childhood literacy statistics on reading activities at home for young children (ages 3-5 not yet in kindergarten):
There were clear racial gaps in home reading activities, too. 91% of White children and 89% of multiracial children had someone read to them three or more times a week. That’s in contrast to 81% of Asian children, 77% of Hispanic children, and 75% of Black children.
Child illiteracy statistics in America: Statistics & facts
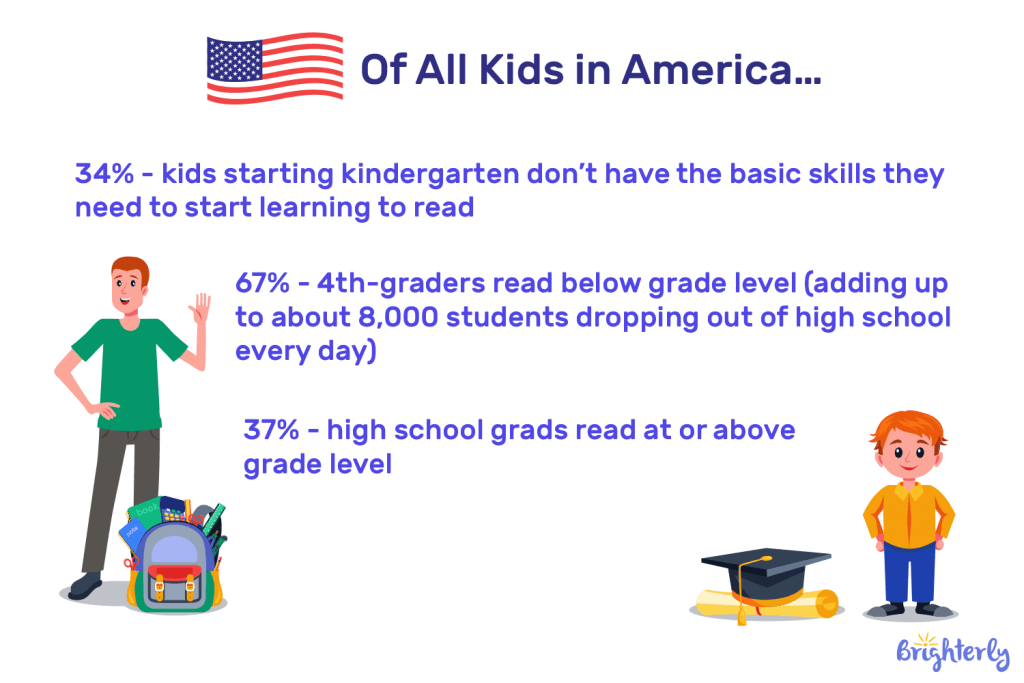
About 25 million kids in the U.S. can’t read at grade level, according to NAEP test results. Does that show how serious America’s reading crisis is? Pretty much. Plus, NAEP data shows that 67% of 4th-graders and 69% of 8th-graders across the country aren’t reading at grade level.
Now that you know the answer to ‘What is the literacy rate in the United States?’, let’s learn more about some other concerning stats:
- Two out of 10 kids start kindergarten with skills two to three years below grade level. Kids who start behind usually only make about a year’s progress each grade.
- About 25% of kids in the U.S. grow up not being able to read.
- A struggling reader at the end of 1st grade has about a 90% chance of still struggling by 4th grade. See? That’s why early help makes such a big difference once kids start to fall behind.
- Kids who aren’t reading at grade level by 3rd grade are four times more likely to drop out of high school than strong readers.
- Kids who start kindergarten behind have less than a 12% chance of ever going to college. That’s how early reading gaps turn into lifelong struggles.
- Around 85% of teens in the justice system can’t read well enough to get by. And about 70% of people in U.S. prisons can’t read above a 4th-grade level.
- 80% of low-income kids aren’t reading at grade level by 4th grade, compared to kids from higher-income families. More specifically, only 20% of 4th graders from low-income families read at grade level. That’s way lower than the 51% of 4th graders from higher-income families who read at grade level.
- Kids whose parents struggle with reading are 72% more likely to read below grade level in school. It keeps the cycle of low literacy going from one generation to the next.
What percentage of Americans are illiterate?
According to the National Literacy Institute, 79% of US adults nationwide were literate in 2024. Thus, approximately 21% of American adults (roughly 43 million people) have limited literacy skills or are functionally illiterate.
Illiteracy in America isn’t something a single number can capture. Literacy falls on a spectrum, from total illiteracy (can’t read or write at all) to functional illiteracy (ability to read and write basic sentences yet inability to comprehend complex texts) to full proficiency.
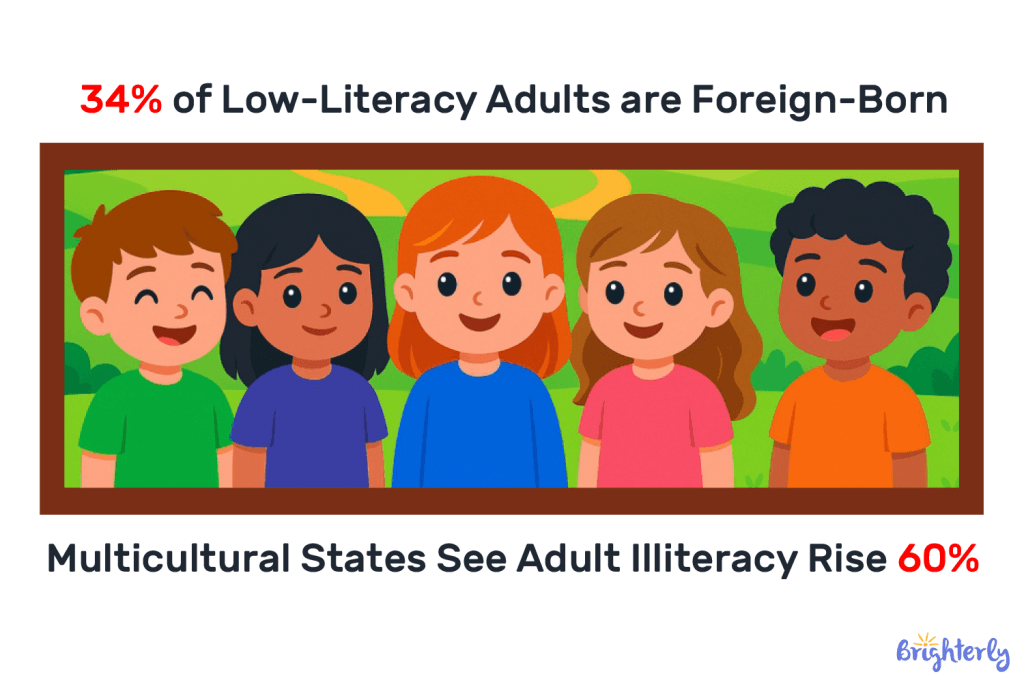
Immigration and literacy
34% of US adults with low literacy weren’t born in the US, with many immigrants, legal or not, being 60% more likely to have adult illiteracy above 20% for the adult population.
According to the 2023 PIAAC data, 18% of US adults ages 16-65 were non-native born (increased from 14% in 2017). Adults born outside the US scored significantly lower due to challenges in English language comprehension: 52% scored at Level 1 or lower in reading compared to 27% of native-born adults. Plus, 52% scored at Level 1 or below in problem-solving skills.
Note: Level 1 literacy means an adult can read and understand short, simple texts and pick out one clear piece of information. They can handle basic tasks like reading a short notice or simple instructions. However, they struggle with longer texts, complicated directions, or reading between the lines.
Gender and age differences
In 2023, according to PIAAC illiteracy rates in America, there were no major gender differences. Both males and females had more adults at the lowest proficiency level:
- Male: 29% at Level 1 or below (increased from 19% in 2017)
- Female: 26% at Level 1 or below (increased from 18% in 2017)
Adults 55-65 did worse than everyone else in both literacy and adaptive problem solving in 2023. The percentages of US adults performing at Level 1 or below in literacy increased across all age groups between 2017 and 2023, except those aged 45-54.
Comparison between child and adult literacy rates
| Group | Assessment / year | Average score | Change from the previous | Historical comparison | % below Basic / Level 1 | Facts about literacy | |
| Overall literacy | Kids (4-8 grade) | NAEP 2022 | 217 (4th), 260 (8th) | ⬇️ 3 points (vs 2019) | Lowest since early 2000s; same as 1992 | 37% (4th), 30% (8th) | Two-thirds of US students are not reading proficiently |
| Adults (ages 16-65) | PIAAC 2023 | 258 | ⬇️ 12 points (vs 2017) | Largest decline since 2012 | 28% at Level 1 or below | Over half of adults read below a 6th-grade level | |
| Proficiency rates | 4 grade | NAEP 2022 | — | — | — | 67% not proficient | Reading proficiency is at its lowest since 2005 |
| 8 grade | NAEP 2022 | — | — | — | 69% not proficient | 30 years of progress erased | |
| Lowest proficiency trend | Both groups | — | — | — | Persistent since the 1990s | 25-33% below basic / Level 1 | Indicates inability to perform age-appropriate reading tasks |
| Cross-generational impact | Kids & adults | — | — | — | — | — | About two-thirds of both age groups struggle with literacy |
Key facts about child literacy
- Current national reading proficiency rates. Only 33% of fourth-grade students nationwide performed at or above the NAEP Proficient level in reading in 2022. That entails that 67% of fourth-graders are not reading proficiently. This shows a decline from 2019, when 34% scored at or above Proficient, and brings reading scores back to early-1990s levels, basically wiping out 30 years of progress. For eighth-graders, the picture isn’t much better! Only 31% scored at or above NAEP Proficient in 2022, down from 34% in 2019.
- The third-grade reading benchmark: A critical turning point. Children who are not reading proficiently by third grade are four times more likely to drop out of high school than proficient readers. The rates are even more alarming for the lowest-performing readers! 23% of children who score at well below grade level in third grade drop out or don’t graduate on time, vs. just 4% of proficient readers. Yes, these below-basic readers make up only about a third of students, but they make up about 60% of kids who don’t graduate, according to child illiteracy statistics.
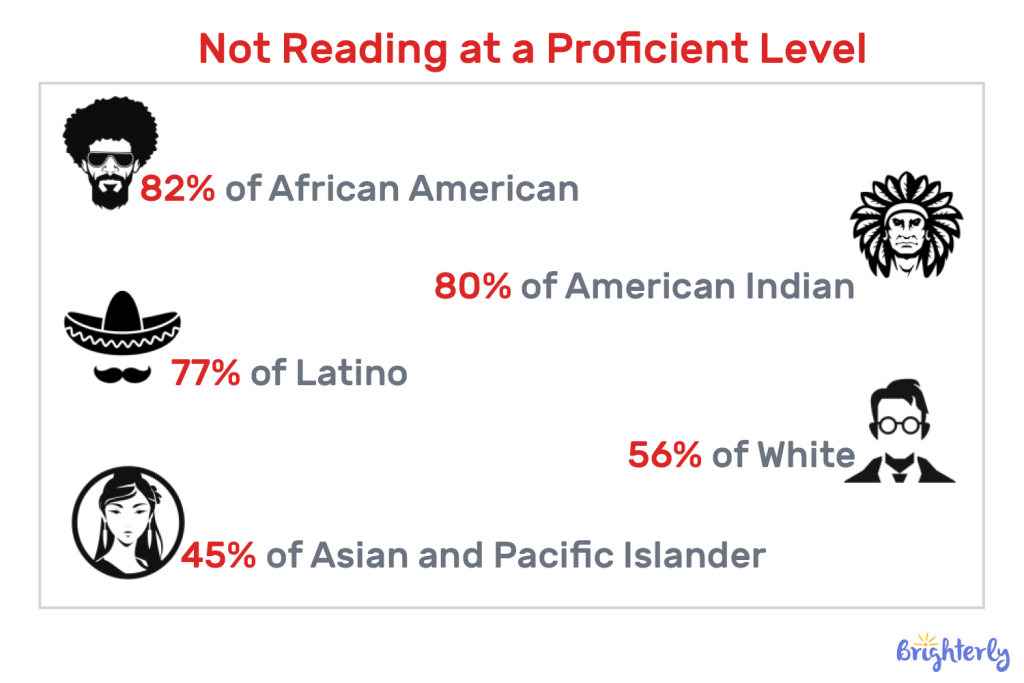
- Racial disparities in reading achievement. According to 2019 NAEP data, the achievement gap still exists across racial and ethnic groups. Here are the shares of those who weren’t reading at a proficient level: Black and Hispanic children who are not reading proficiently in third grade are twice as likely as similar white children not to graduate from high school (25% versus 13%). When you factor in poverty, Black and Latino students who read poorly are eight times more likely not to graduate than all proficient readers.
- The poverty factor: Double jeopardy for struggling readers. Students who live in poverty are three times more likely to drop out or fail to graduate on time than their better-off peers. When combined with poor reading skills, the dropout rate becomes six times greater than that for all proficient readers. Nationally, about 80 percent of low-income children are not reading on grade level by fourth grade, according to NAEP results. Perhaps most striking, though, proficient third-graders who have lived in poverty graduate high school at about the same rate as struggling readers who have never been poor. That’s how much poverty affects kids’ education, even for skilled readers.
Conclusion
As you can see, only about one-third of students are reading proficiently, and performance is still lagging behind pre-pandemic levels. Given that literacy opens doors to lifelong learning, confidence, and academic success, early reading support is indispensable.
If your child struggles to read at grade level, Brighterly’s reading tutors developed personalized one-on-one reading lessons to help kids build comprehension, fluency, and confidence step by step.
If your child is already reading well, they can help them stay ahead and build strong thinking skills.
And if you’re unsure where your child stands, book free reading lesson and find out!


Science is full of “wow” moments! I’m your science buddy, and today we’re diving into some fun science facts for kids. Did you know that some fish can fly or that your brain works faster than a computer? Let’s explore together – I bet you’ll impress your parents or best friends with what you learn! […]

Oct 31, 2025

Don’t mistake reading challenges — they aren’t about making reading difficult. In fact, they are the opposite! Reading challenges for kids are all about making the reading fun and even more motivated to think and reflect on literary pieces. In this article, I will take a closer look at what reading challenges are and how […]

Nov 05, 2025
Math & reading from 1st to 9th grade
Looking for homework support for your child?

Choose kid's grade
Math & Reading for Grades 1–9
Build real confidence for your child with a Brighterly math or reading tutor.