Reading Scores Statistics in 2026
reviewed by Franz Jerby Delos Santos
Updated on January 25, 2026
Are American schools still providing the quality reading education they once did? And will your children be competitive with students from other countries? In this article, I’ll examine the latest U.S. reading scores statistics and compare them internationally to show what the numbers mean for students and parents.
Key points
- Educational authorities use frameworks like NAEP and MAP to assess reading skills, including comprehension, critical thinking, and overall literacy.
- Data show a decline in NAEP reading proficiency among U.S. students. Elementary, middle, and high school students are all affected, with a widening achievement gap between weaker and average students.
- Across the U.S., Massachusetts and New Jersey rank highest in reading performance, while states such as Oklahoma and New Mexico underperform.
- The International PISA 2022 exam showed that U.S. high school students perform above the global average in reading but lag behind top East Asian and European countries.
- Parents can help through encouraging out-of-school reading and interactive lessons with a skilled teacher – exactly what Brighterly offers to help kids fall in love with reading.
Why measure reading skills?
Measuring reading skills is important because they are the foundation taught in school that largely determines a child’s further educational progress. From building language for writing and debating to understanding school tasks, proficient reading is essential for achieving success in academic pursuits and in a career.
It is no surprise that educational authorities place particular attention on evaluating the reading skills of pupils as a step to assess how state education fulfills its mission to raise an educated generation.
What are the statistics for reading proficiency in the US?
The statistics for reading proficiency in the U.S. reveal a steady decline in students’ reading skills, with the sharpest drops seen among low-performing learners.
But before we dive into the numbers, it’s important to clarify the terms behind “reading statistics.” So, what are the statistics on reading? In an attempt to summarize the data, the statistical board came up with a range of cognitive targets referring to kinds of thinking that underlie reading comprehension. For example, in the United States, the widely used Measures of Academic Progress (MAP) assessment tracks a student’s academic achievement and growth in subjects such as reading. Also, the U.S. Department of Education administers the so-called National Assessment of Educational Progress (NAEP) framework that measures students’ abilities to:
- Locate and recall information from what they have read.
- Integrate and interpret information, like explaining the main idea of a story.
- Critique and evaluate the quality and arguments of a text.
Similarly, the test developed by the International Programme for International Student Assessment (PISA) measures how well a child understands, uses, and reflects on written texts. If you are interested, you can find some relevant reading data in the article Reading Statistics and Facts.
Below, I will focus on the recent NAEP and PISA performance of American children. Meanwhile, tools like Brighterly, a reading and math tutoring platform, have proven to be the most effective way to improve reading skills.
How Brighterly might help to improve reading skills
I love recommending Brighterly because, as a teacher, I see how much children enjoy their lessons and actually look forward to reading when studying here.
That’s because the reading program at Brighterly has several standout features.
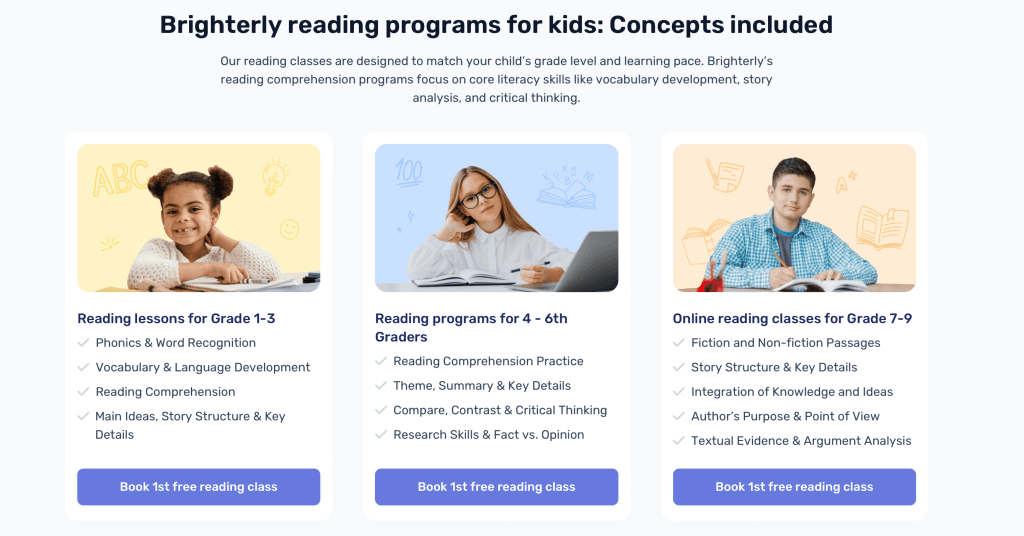
- First, lessons are designed to help children analyze texts, spark imagination, and build knowledge – while also improving writing, speaking, and critical thinking.
- Second, the platform is fully personalized. Each student has 1-on-1 sessions with a tutor focused only on their challenges, progress, and successes.
- Third, Brighterly’s certified tutors know how to improve MAP reading scores, address common reading difficulties, and inspire kids to love learning. Each lesson is adapted to the child’s needs and supported with free reading worksheets.
- Finally, tutors track each child’s results and share them with parents, showing steady progress in comprehension, vocabulary, and critical thinking – skills measured by NAEP and PISA.
Note: Brighterly tutors work with children from grades 1-9, and the entire reading program follows the U.S. school curriculum. This directly helps kids improve their academic performance and stay confident in class.


Check the basics behind this term
Take our quick quiz to discover the perfect learning solution based on your child’s needs.
NAEP reading scores 2022 – 2026
First, I’ll present the results from the U.S. Department of Education’s NAEP framework, often referred to as the Nation’s Report Card, the largest nationwide assessment of what students know and can do in key subjects.
The data covers three assessments – 2019, 2022, and 2024, so you can see how COVID-19 affected learning. Reading score statistics are assessed on the scale from 0 to 500. NAEP also distinguishes between “Advanced” (superior reading skills), “Proficient” (solid comprehension and analysis), and “Basic” (only partial mastery) reading levels.
Reading scores by grade: Grade 4 Students
Finally, from words to data. As shown in the image below, the U.S. test scores by year for Grade 4 reveal a clear decline. In 2024, the national average was 215, down from 220 in 2019. Top students stayed mostly steady, but the scores of low-performing pupils dropped significantly.
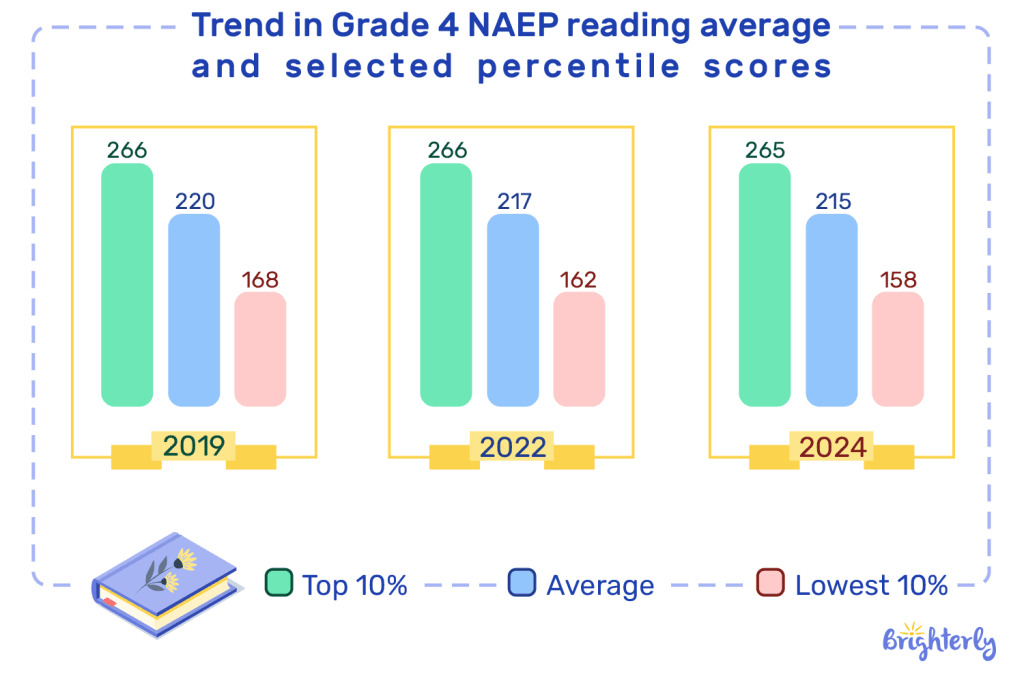
Overall, only 60% of Grade 4 students met the basic NAEP level, 31% performed at the Proficient level, and 8% scored Advanced.
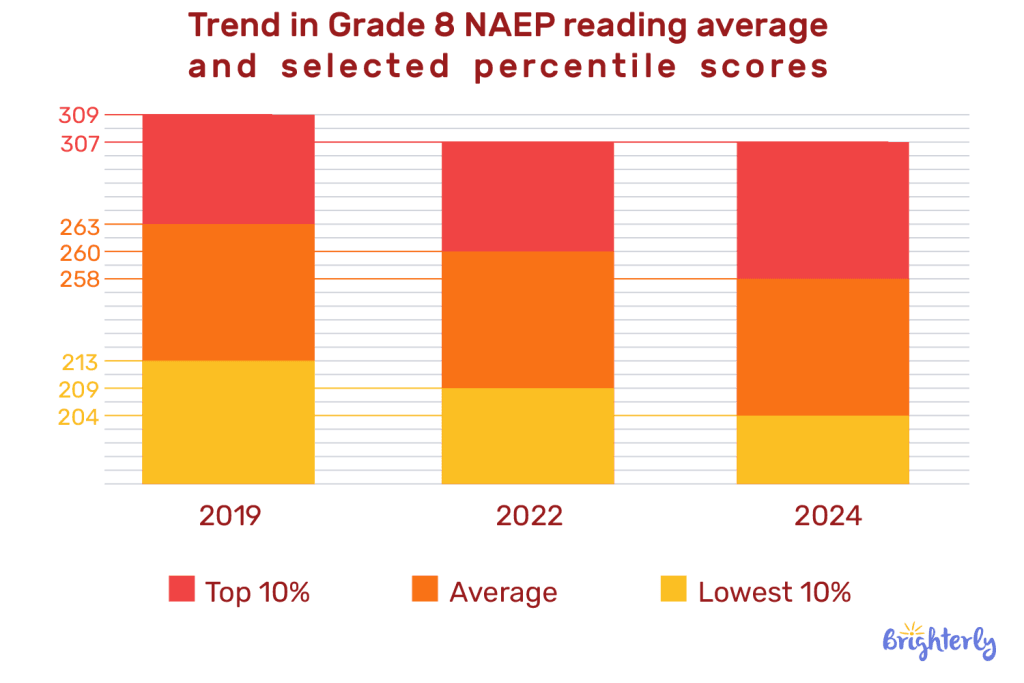
Reading scores by grade: Grade 8 Students
The picture isn’t much better for Grade 8. In 2024, average reading score statistics fell to 258, while the lowest scores dropped noticeably by 9 points since 2022. Only 30% of students reached the NAEP Proficient level, and 4% scored Advanced. However, one-third of students didn’t even meet the basic NAEP level, which is the largest it has been in the exam’s three-decade history.
Reading scores by grade: Grade 12 Students
For the final-year high-school and college students, the national average dropped from 285 in 2019 to 283 in 2024. Top and bottom scores fell by about 3 points.
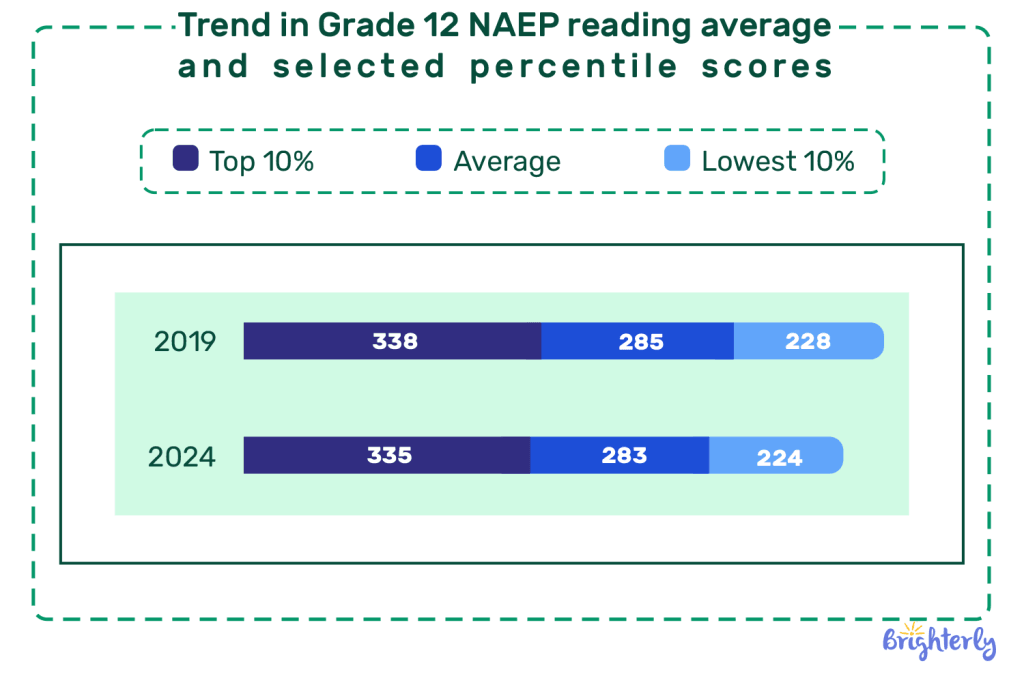
Roughly 32% of students scored below the Basic NAEP level, meaning they struggle even with finding key information in texts. Slightly more, 35% of students met the NAEP Proficiency level, out of whom a mere 5% performed at the Advanced level in 2024.
Distribution of Students by Achievement Level, 2024 NAEP
Grade 4 |
Grade 8 |
Grade 12 |
|
NAEP Basic |
40% | 33% | 32% |
NAEP Basic |
29% | 37% | 33% |
NAEP Proficient |
23% | 26% | 29% |
NAEP Advanced |
8% | 4% | 5% |
What does the NAEP Reading data show?
To summarize, reading scores by grade show us that after a period of reading skills improvements throughout the early 2000s, the reading skills among school-age children started to decline notably. What is also noticeable is that weaker students are falling behind at a faster rate than the average student, meaning that educational inequality is widening. The performance gap between struggling and typical learners gets even larger.
Reading scores by state: Grade 4 students
Next, I will show states ranked by reading scores. In 2024, the northeastern states of Massachusetts, New Jersey, Connecticut, and New Hampshire, along with Colorado and Utah, showed the best results. Still, only about 40% of students reached NAEP Proficient.
The lowest reading scores by state were in Oklahoma, Alaska, and New Mexico, with just 20–22% of students achieving Proficient status.
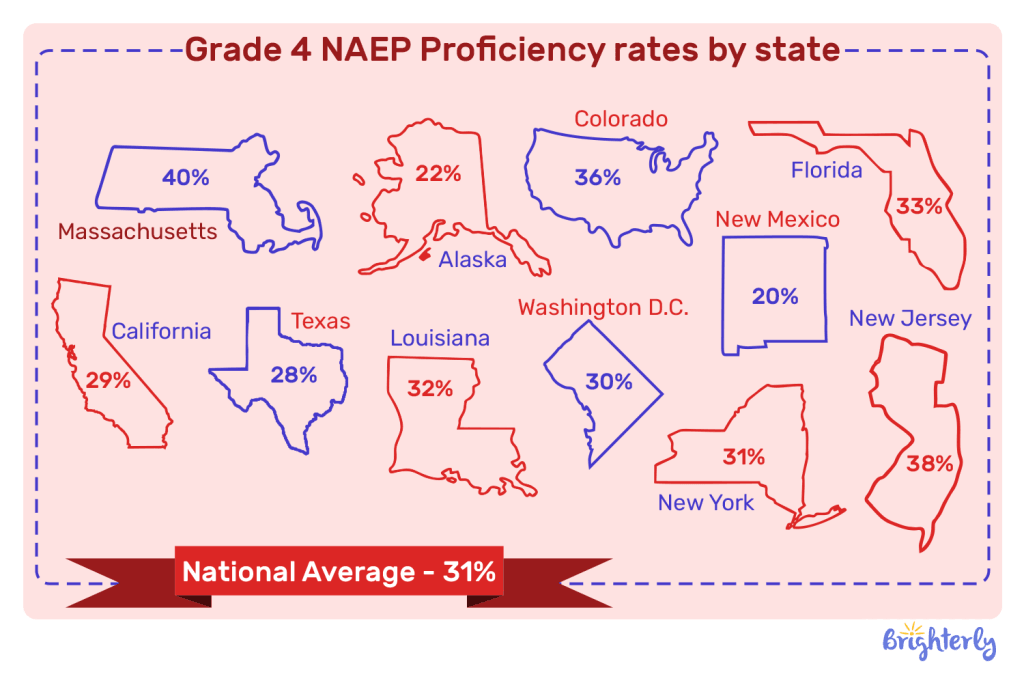
Between 2022 and 2024, only a few states showed meaningful improvement, such as Louisiana and Washington, D.C., while others, like Florida, Nebraska, and Arizona, saw declines. Across 25 major U.S. districts, only Atlanta had more Grade 4 students performing at or above NAEP Proficient than in 2022.
Reading scores by state: Grade 8 students
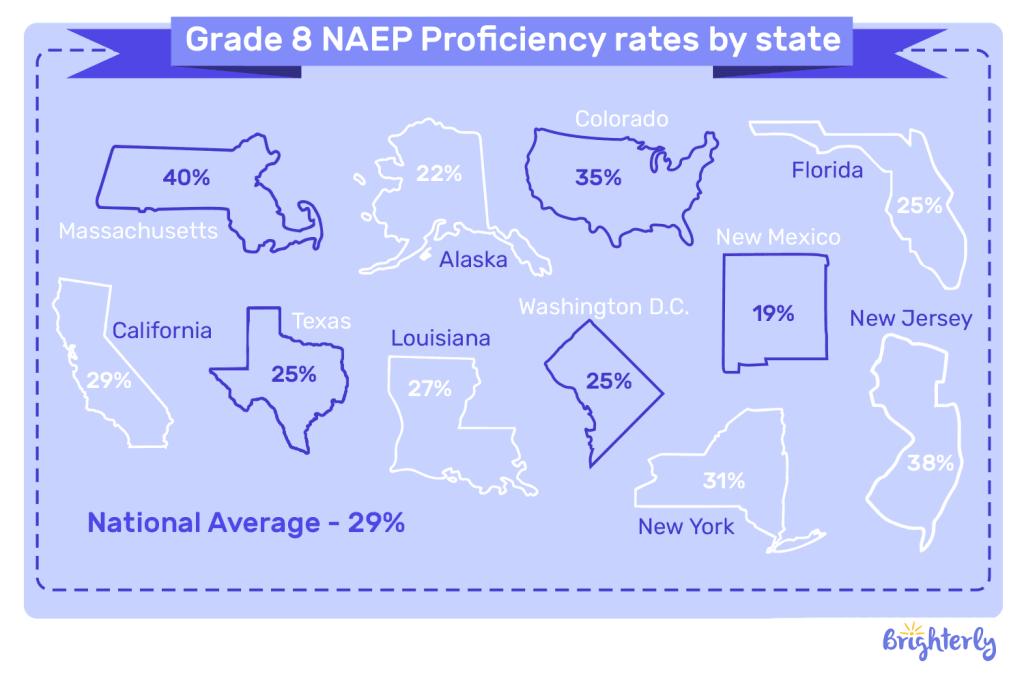
Reading proficiency levels by state are astonishingly similar for Grade 8 students. The percentage of students meeting NAEP Proficiency is the largest in Massachusetts (40%), New Jersey (38%), Colorado (35%), and Connecticut (35%), while West Virginia (21%), Oklahoma (20%), and New Mexico (19%) are the outsiders. The national average stood at 29%.
Reading scores by school location
I always pay attention to how students perform by community type – city, suburban, town, or rural. For Grade 4, reading diagnostic scores dropped across all areas, with the biggest declines in suburban and rural schools. In Grade 8, the national average reading proficiency stayed mostly steady in rural areas but fell by 2-4 points elsewhere.
Note: The drop hit low-performing students the hardest. Children in towns and rural areas often face extra challenges, like fewer resources and less experienced teachers. That’s why it’s so important for parents to encourage daily reading at home and use tools like Brighterly to support skill-building outside school. Even small, consistent reading sessions can make a difference over time.
Reading scores statistics by year: Change in average NAEP score across school locations (2024 vs/ 2022)
Grade 4 |
Grade 8 |
|
City |
-2 pts | -2 pts |
Suburban |
-4 pts | -3 pts |
Town |
no change | -4 pts |
Rural |
-3 pts | no change |
What is the average overall reading level across countries?
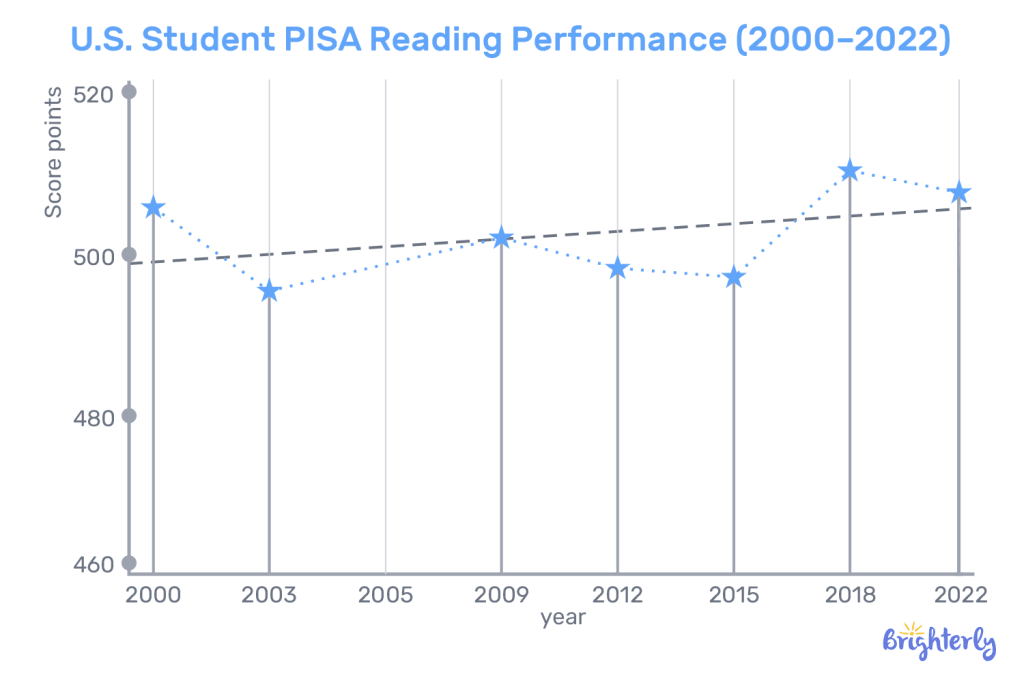
The average overall reading level across countries is fixed at 476, as shown by the latest 2022 PISA reading statistics. By contrast, the U.S. students scored 504 points in this evaluation.
To elaborate, PISA is an international assessment run every three years by the Organisation for Economic Co-operation and Development (OECD). This data is the world’s most widely recognized benchmark for measuring the skills of 15-year-olds. This survey doesn’t have a maximum score, but is balanced on a scale around a 500 score
The most recent exam, PISA 2022, involved more than 600,000 students (15-year-olds) from 81 countries. As mentioned, the average reading score of 15-year-old test takers in the United States stood at 504 points, relatively stable compared with 2018, yet still trailing the top-performing countries.
Which country has the best reading scores?
The country with the best reading scores is Singapore, followed by Ireland, Japan, Korea, Taiwan, and Estonia. Finland, once a global role model for education, dropped to 490 points.
At the other end, the Philippines, Uzbekistan, and Cambodia showed the weakest results. In these countries, many students struggle to reach the baseline reading level needed to identify main ideas, draw simple inferences, or grasp basic text meaning.
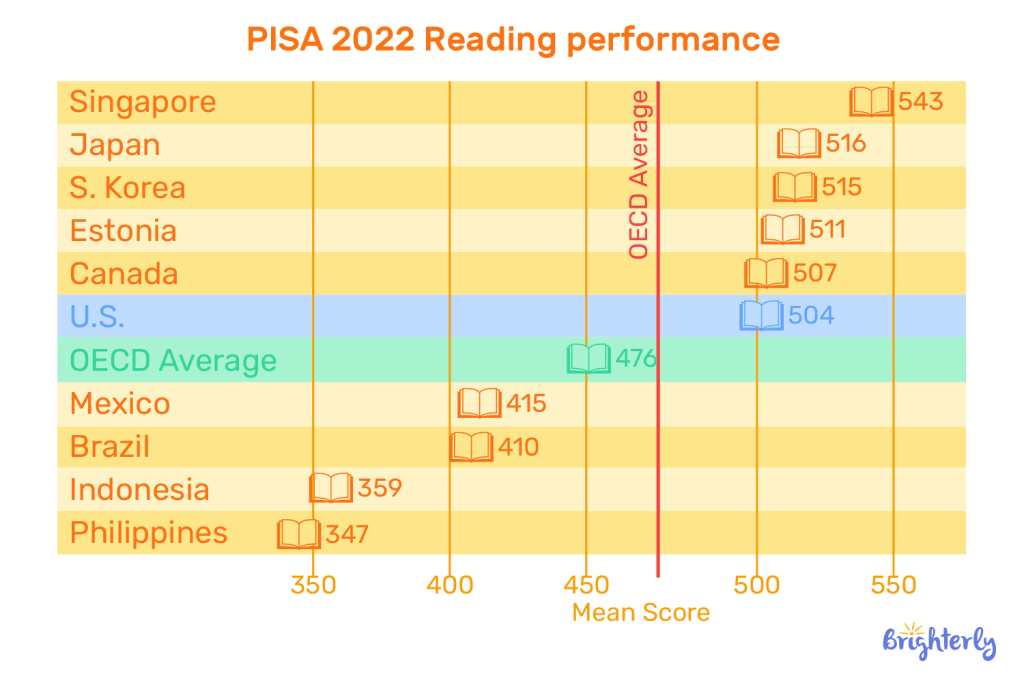
To understand, the spread between the highest performer, Singapore, and the lowest, Cambodia, was more than 200 points, which is roughly equivalent to more than five years of schooling. Just imagine this education gap.
What PISA test scores tell us about the performance of American students?
Returning to the U.S. pupils, their PISA 2022 reading scores statistics were the only bright spot in the broad PISA assessment that also includes math and science. For example, the deterioration in math was devastating – American students scored 13 points lower than in 2018, which is equivalent to losing approximately 7 months of education in the subject. These were the lowest U.S. math scores recorded in the history of the PISA math test.
Note: In the United States, about 80% of students reached at least Level 2 in reading. This means they can find the main idea in a text and understand its purpose. At the top end, 14% of students scored at Level 5 or higher, showing strong reading skills. These students can handle long texts, grasp abstract ideas, and tell the difference between facts and opinions.
Interestingly, girls outperformed boys in reading by 22 score points in the United States. The share of low performers (below Level 2) is larger among boys (24% of boys compared to 16% of girls). When it comes to top performers, however, the share is similar among girls and boys.
Although PISA reading results may appear decent for U.S. students, they do not reflect an improvement in reading comprehension, but rather show that they held their ground and moved up in the rankings while scores in other countries declined.
Also, while the PISA results are from 2022, the domestic NAEP reading score statistics 2022– 2026 reveal a further decline in reading comprehension among elementary and middle school students after 2022.
What are the potential reasons for the decline in reading scores?
The potential reasons for the decline in reading scores include excessive screen time, shortened attention spans, and a decline in book reading. The COVID and post-COVID periods also played a huge role; however, it’s not the key reason.
According to Dr. Carol Jago, associate director of the California Reading and Literature Project at UCLA, the decline also reflects a shift in how English and language arts are taught. Twenty years ago, it was common for high school students to read around 20 books a year, whereas today, many classes assign only about three.
Note: Part of the problem is also students’ absenteeism, as noted in the NAEP survey – 31% of fourth graders reported missing 3 or more days of school in the month before taking the assessment in 2024, as compared to 24% back in 2019. The pandemic and the shift to online education have radically reshaped the education system.
All in all, I can state that despite the country spending billions annually on numerous educational programs, in the end, the achievement gap is widening, and more students are now performing below the basic benchmark in math and reading than ever before.
How can parents support reading skills development?
As a teacher, I have some tips for parents on how they can help their children develop reading skills, especially when school lessons alone may not be sufficient, as shown by the reading scores statistics.
- First, encouraging daily reading is essential. Parents can check their child’s reading speed against the Average Reading Speed by Age benchmarks and set aside dedicated time each day for any sort of reading. Interesting reading should complement school assignments, and it is preferred that children engage in reading of different genres, as it significantly broadens their vocabulary. Children with Attention Deficit Hyperactivity Disorder (ADHD) require specialized support, as detailed in ADHD and Reading article. Never forget that a good teacher always gives credit for progress to motivate children.
- Second, parents should try to engage a child in discussions about texts. As a teacher, I always ask a kid to summarize or reflect on what they read. These conversations may focus on main ideas, author intent, and connections to some real-life situations.
- Finally, technology can be used strategically to support reading. Educational apps, audiobooks, and e-books can supplement traditional reading, as children like to spend time with gadgets.
Nowadays, there are some great online platforms that provide interactive reading lessons. In contrast to the standardised school curriculum, such tools as Brighterly provide personalized lessons that adapt to each child’s level, helping struggling readers to catch up and practice more often, also showing how to improve MAP reading scores. Integrating such digital platforms with daily reading habits complements traditional school and helps close the troubling literacy gaps.
Check the basics behind this term
Take our quick quiz to discover the perfect learning solution based on your child’s needs.
Reading scores statistics for elementary students
The 2024 NAEP assessment showed a prolonged decline in reading scores statistics for elementary students in the United States. The national average score dropped to 215, down from 217 in 2022. Approximately 61% of students performed at or above the Basic level, 32% at or above Proficient, and only 8% at Advanced. The lowest-performing students experienced the largest declines in scores, illustrating a widening achievement gap.
Reading scores statistics for middle school students
Reading scores statistics by year indicate that the national average score in reading for 8th graders fell from 260 in 2022 to 258 in 2024. What is more concerning is that more 8th graders are falling below the Basic level than before. In 2024, around 33% of students were below Basic level, the record-high in the exam’s three-decade history.
Reading scores statistics for high school students
In 2024, the average reading score for the nation at Grade 12 was 3 points lower than in 2019. Compared to the first reading assessment in 1992, the average score was 10 points lower in 2024. The steepest decline was once again recorded among the lowest performing pupils. Just 35% of high school students meet the NAEP Proficiency level, while 32% of graduating students didn’t meet the basic level.
Conclusion
Reading is the foundation for all learning – yet many children in the United States are struggling. NAEP and PISA reading score statistics show a steady decline. Clearly, the situation has worsened due to the pandemic and because kids spend less time reading today. Government programs haven’t reversed the trend, which makes it crucial for parents to act.
This is where Brighterly can help. Progress starts with a reading test that highlights each child’s strengths and weaknesses. Based on these insights, certified tutors design a personalized program that builds comprehension, expands vocabulary, and boosts confidence step by step. Book free reading lesson and open the door to lifelong reading success today.


Wondering whether Time4Learning is worth it for homeschooling your child? Check out a roundup of all Time4Learning reviews in one place to see how good it is in terms of functionality, learning approach, UI/UX, overall effectiveness, and customer support – and most importantly, if it has good value for money. Key points Features: 8/10. The […]

Sep 18, 2025
Looking for an effective way to help your young child learn to read better? Hooked on Phonics vs ABC mouse vs Brighterly all offer good options, albeit through a different methodology and various features. As an ELA teacher with years of experience, I’ve compared the three platforms, including their learning philosophy, functionalities, pricing, and parents’ […]

Sep 19, 2025
Math & reading from 1st to 9th grade
Looking for homework support for your child?

Choose kid's grade
Math & Reading for Grades 1–9
Build real confidence for your child with a Brighterly math or reading tutor.