Standardized Testing Statistics 2025–2026
reviewed by Jo-ann Caballes
Updated on July 20, 2026
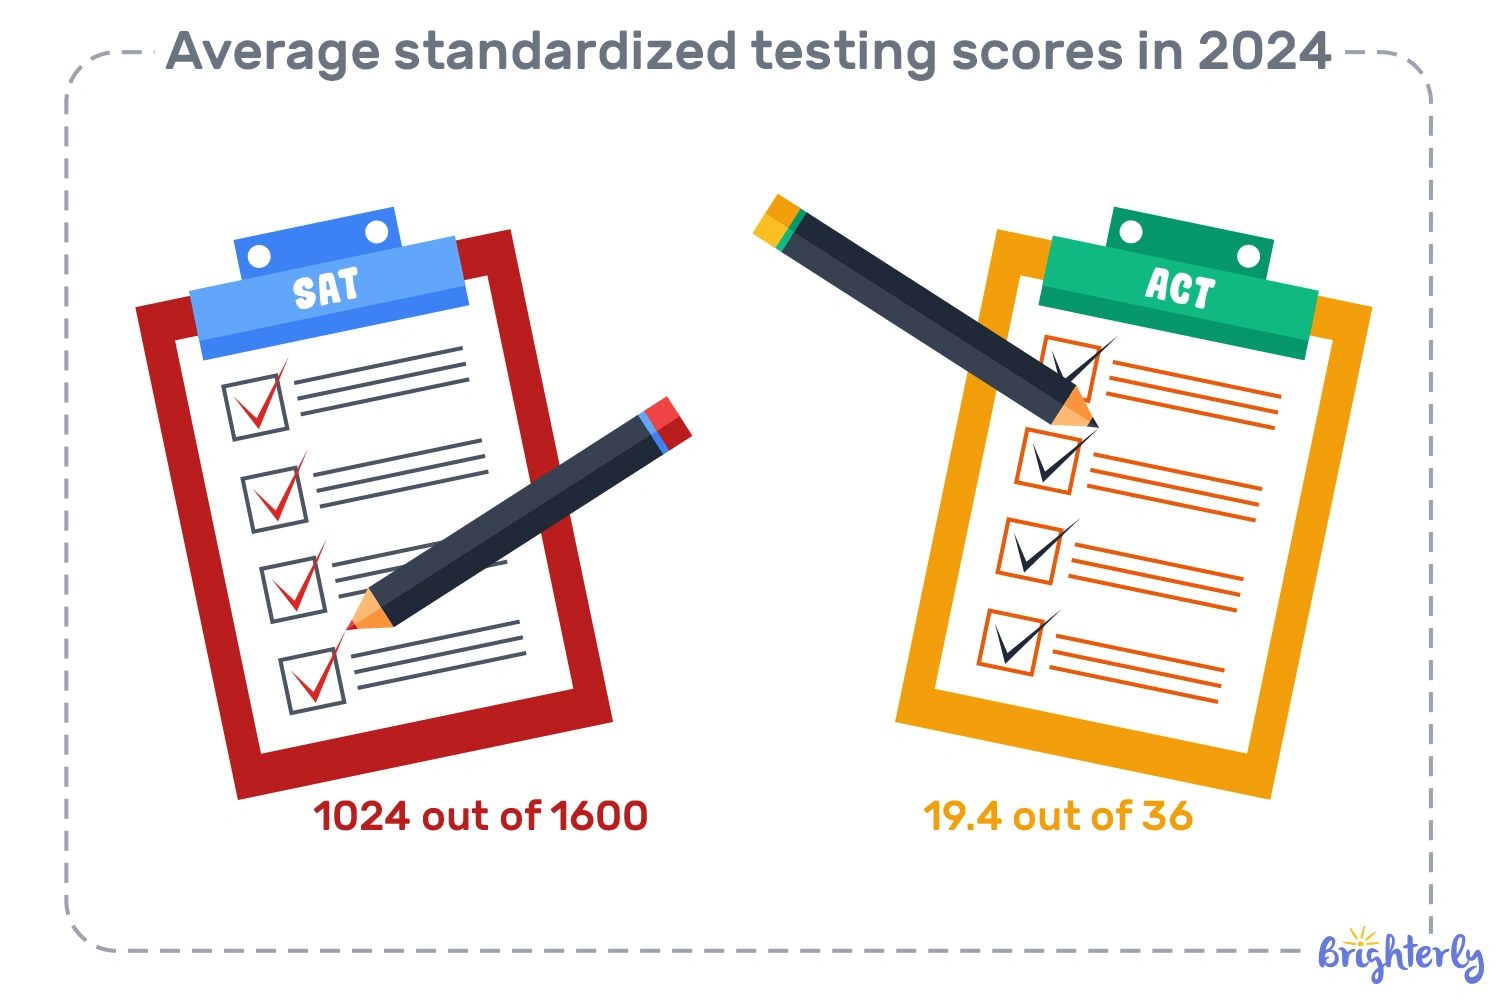
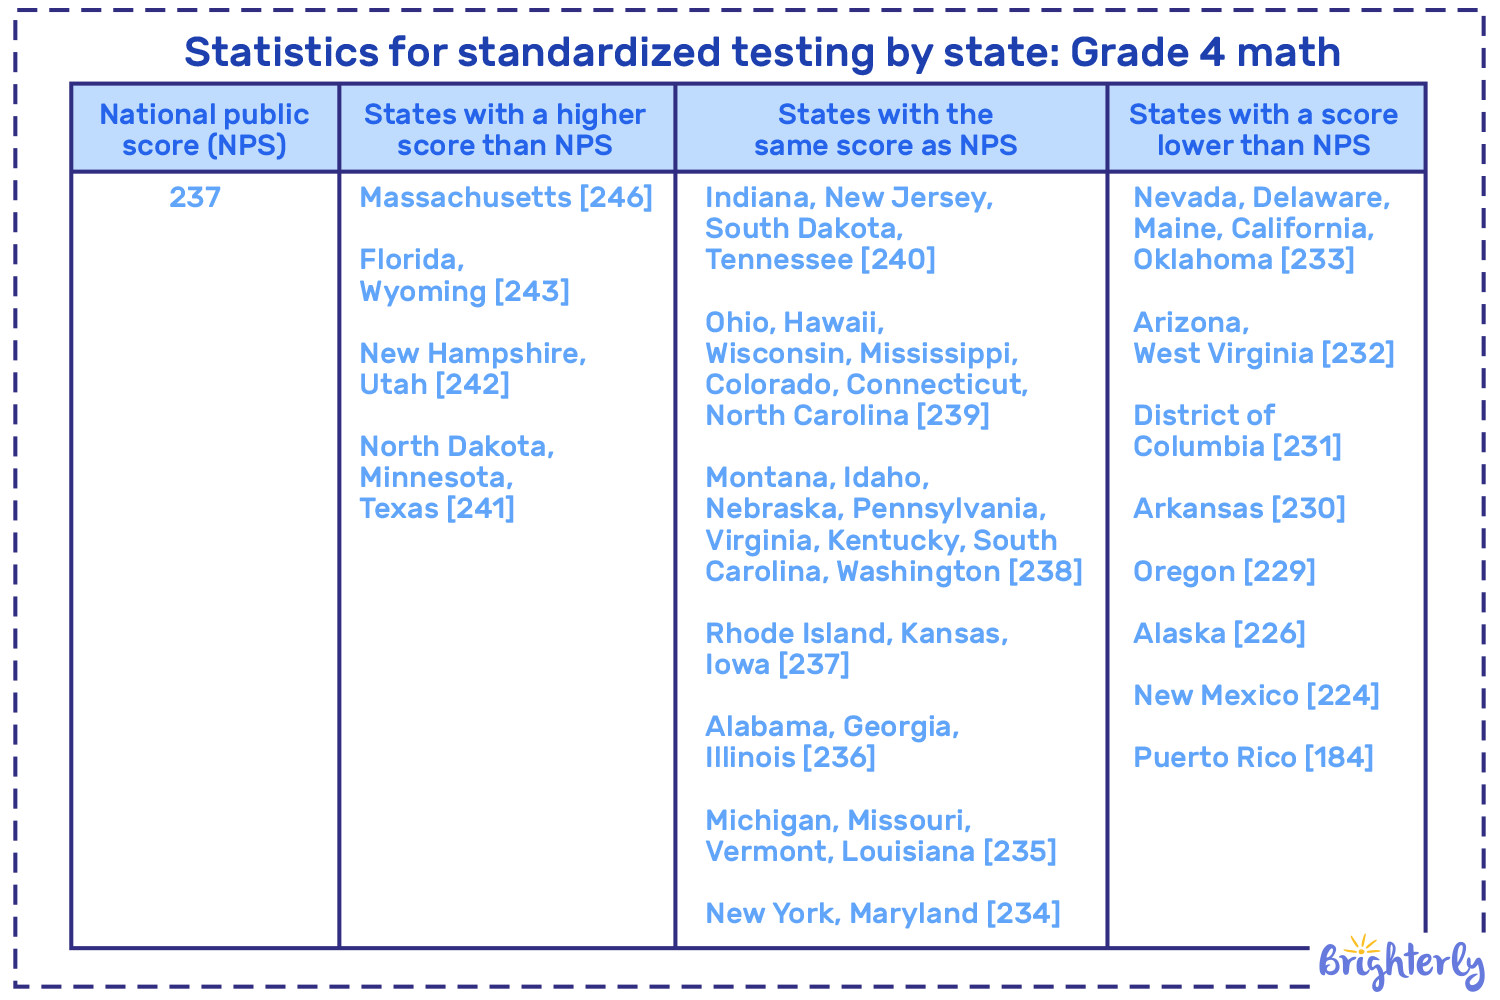
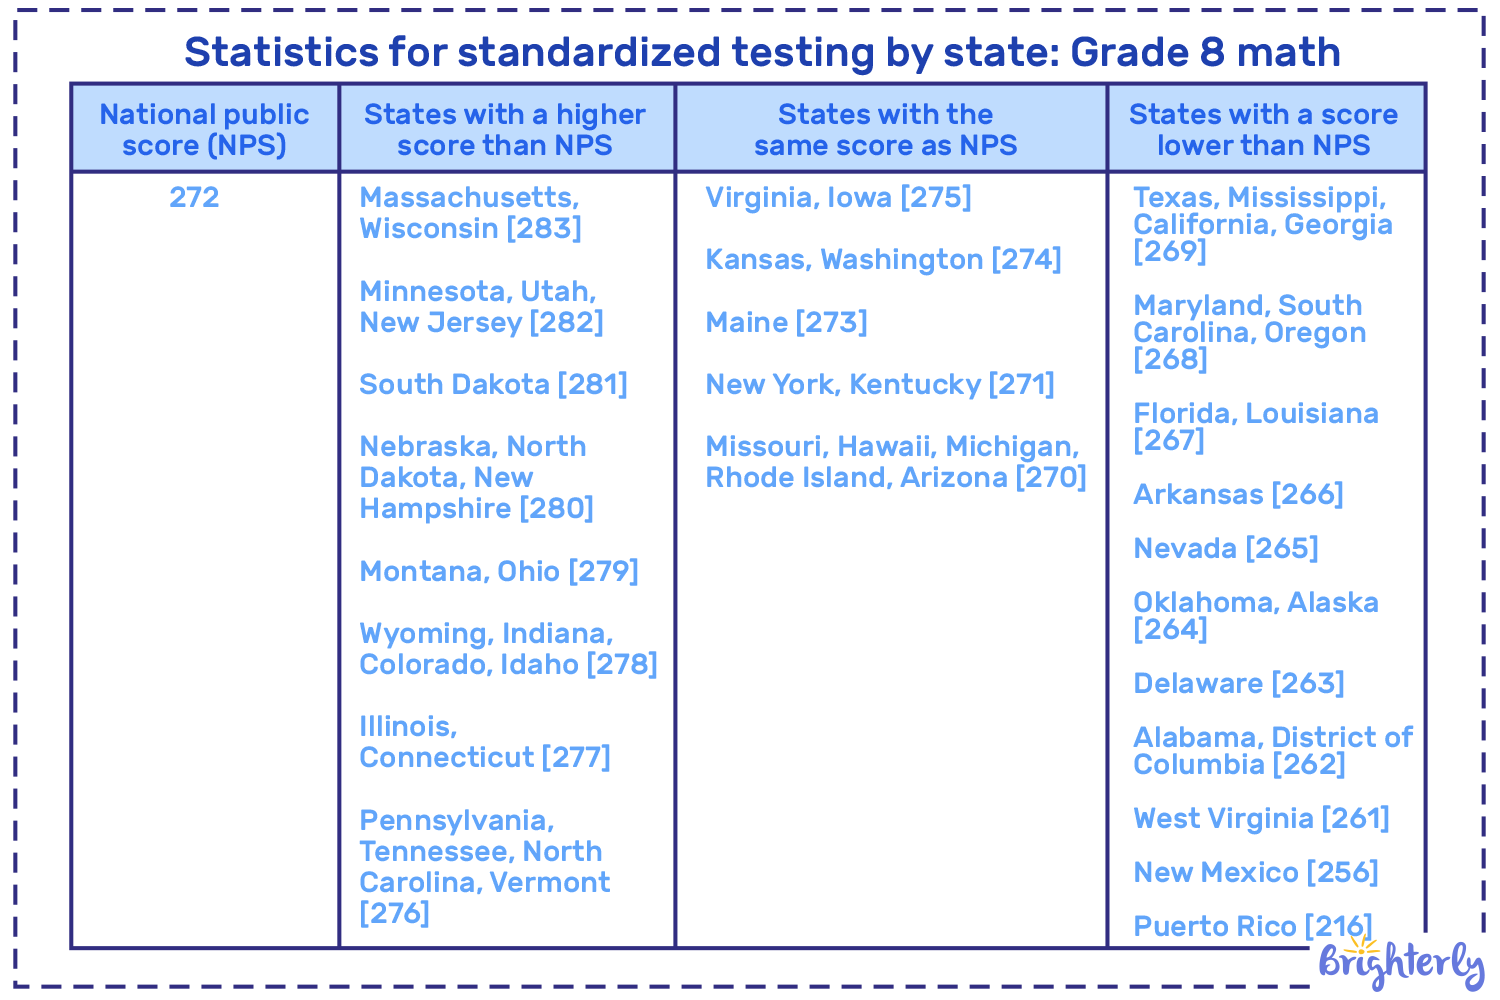
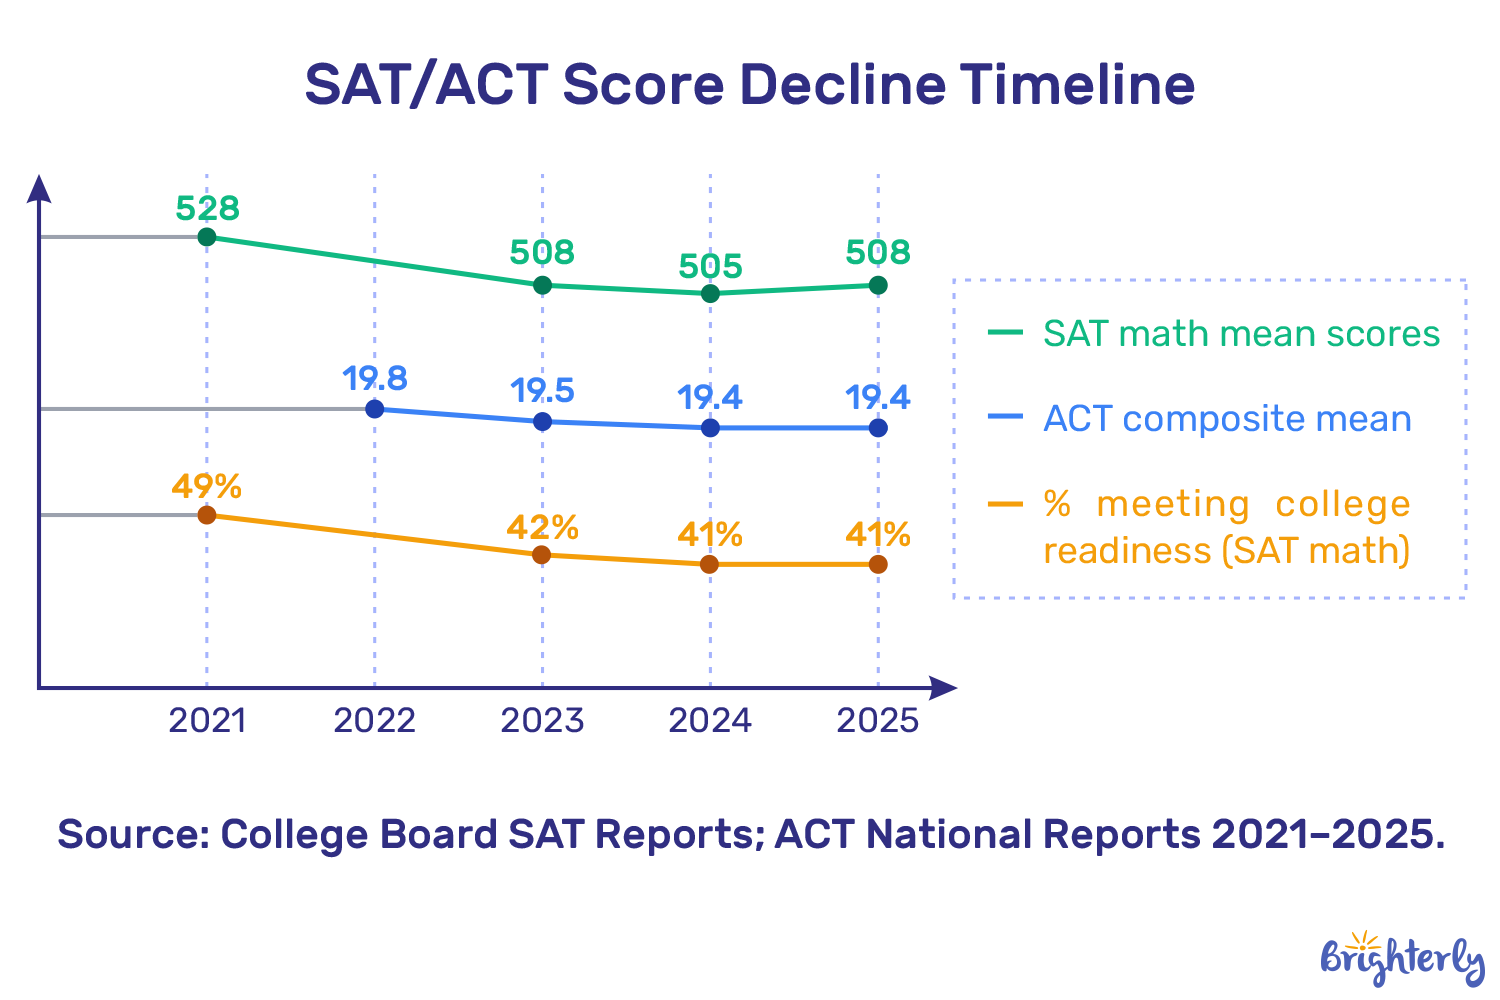
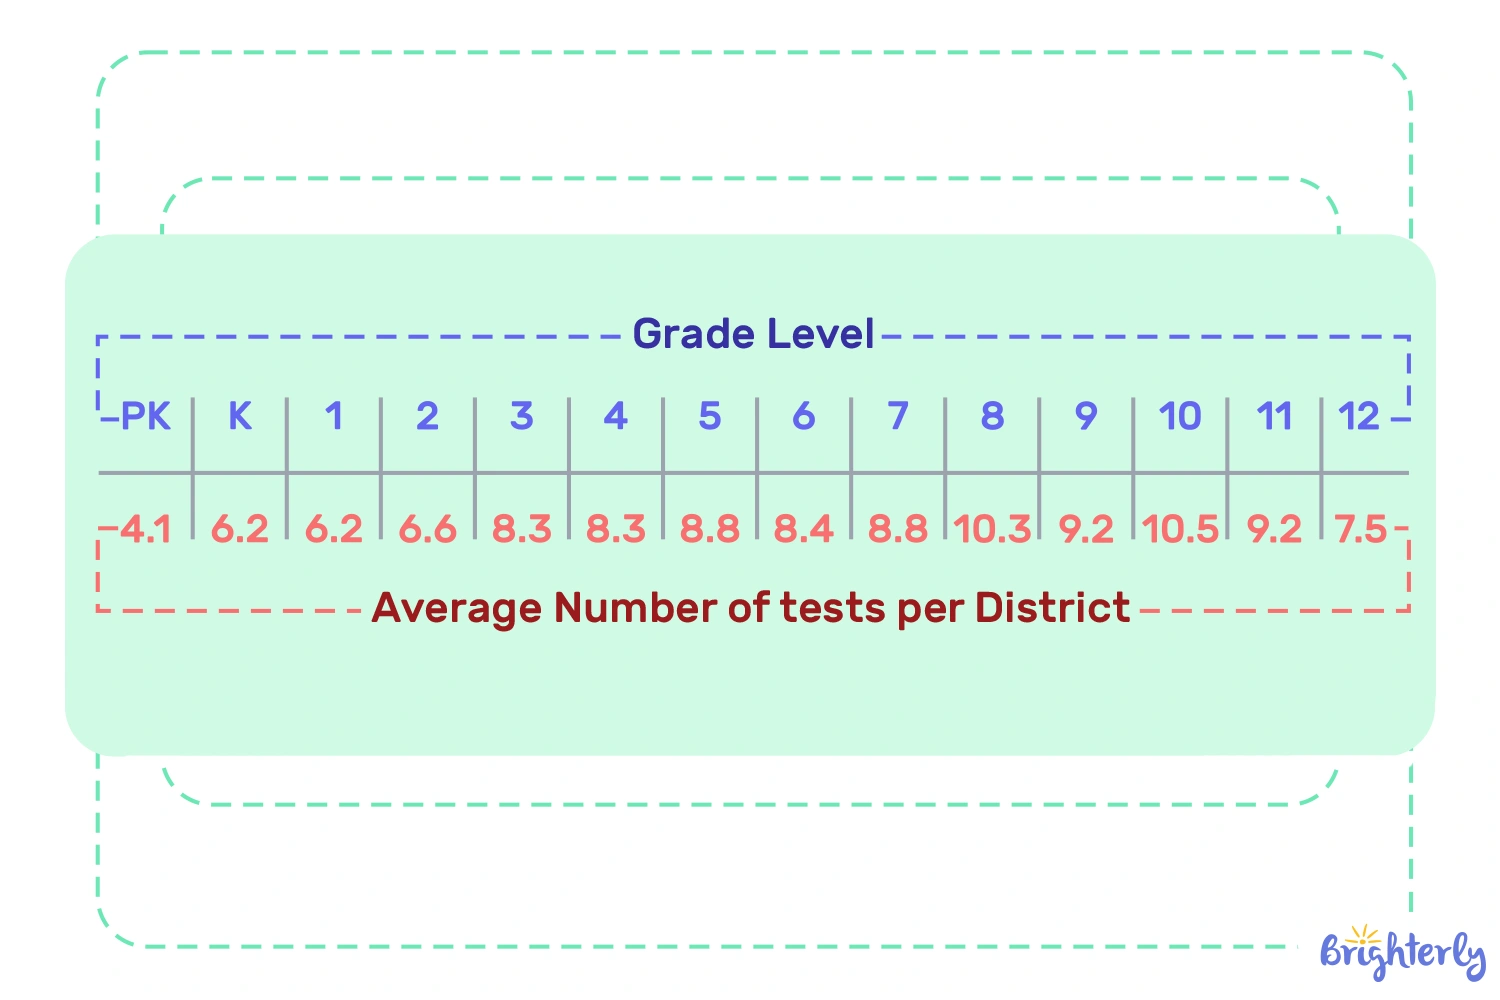
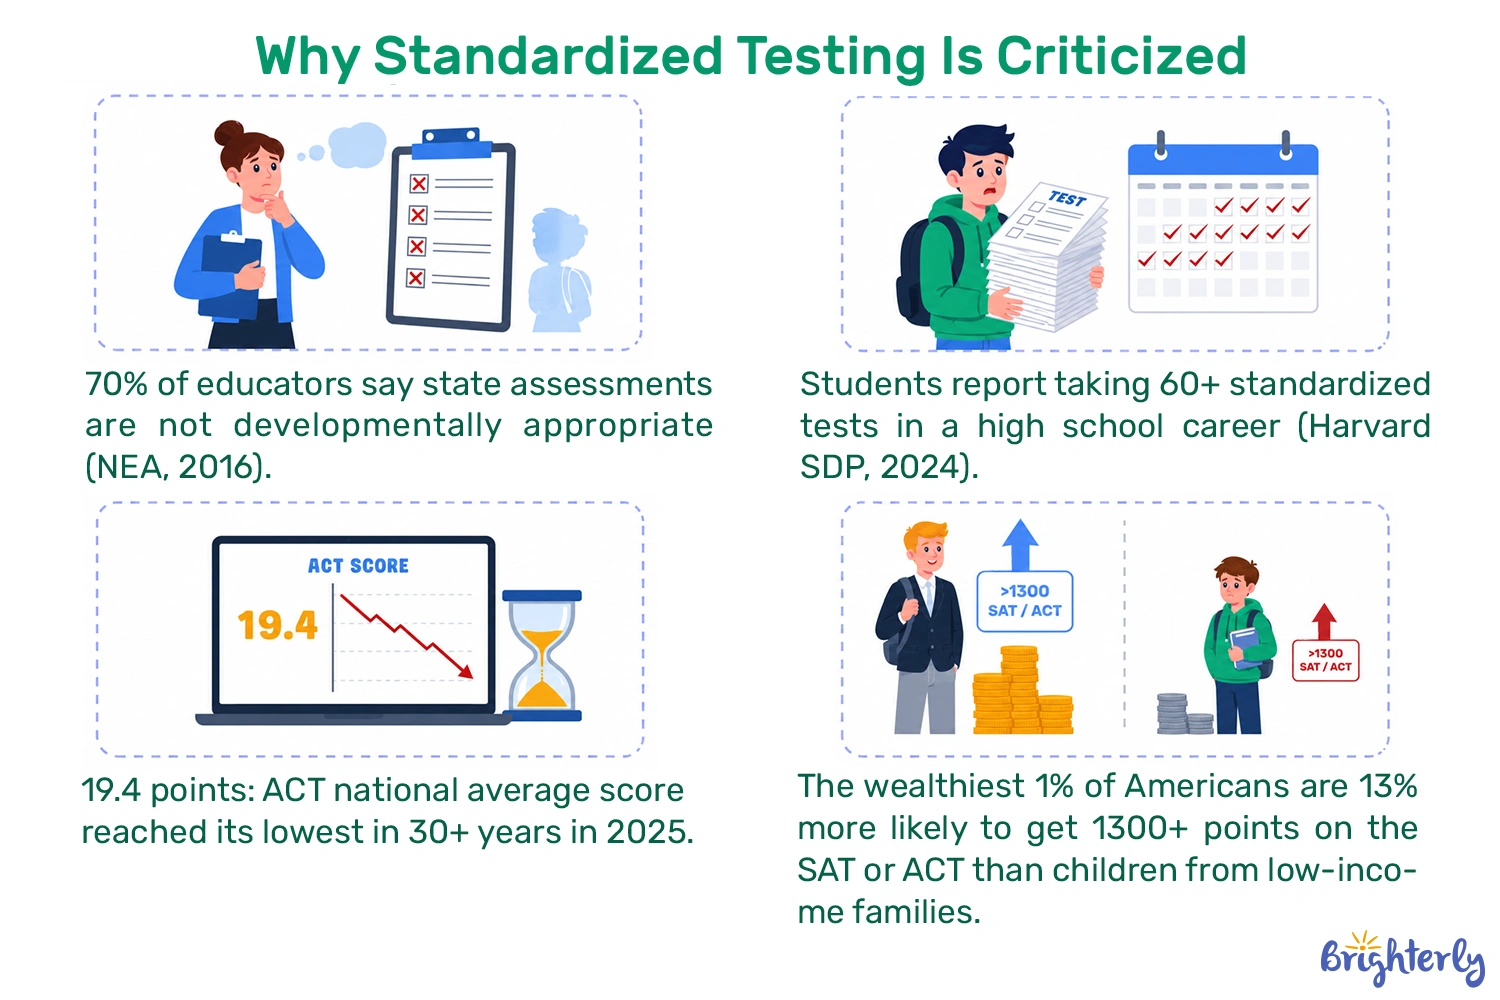
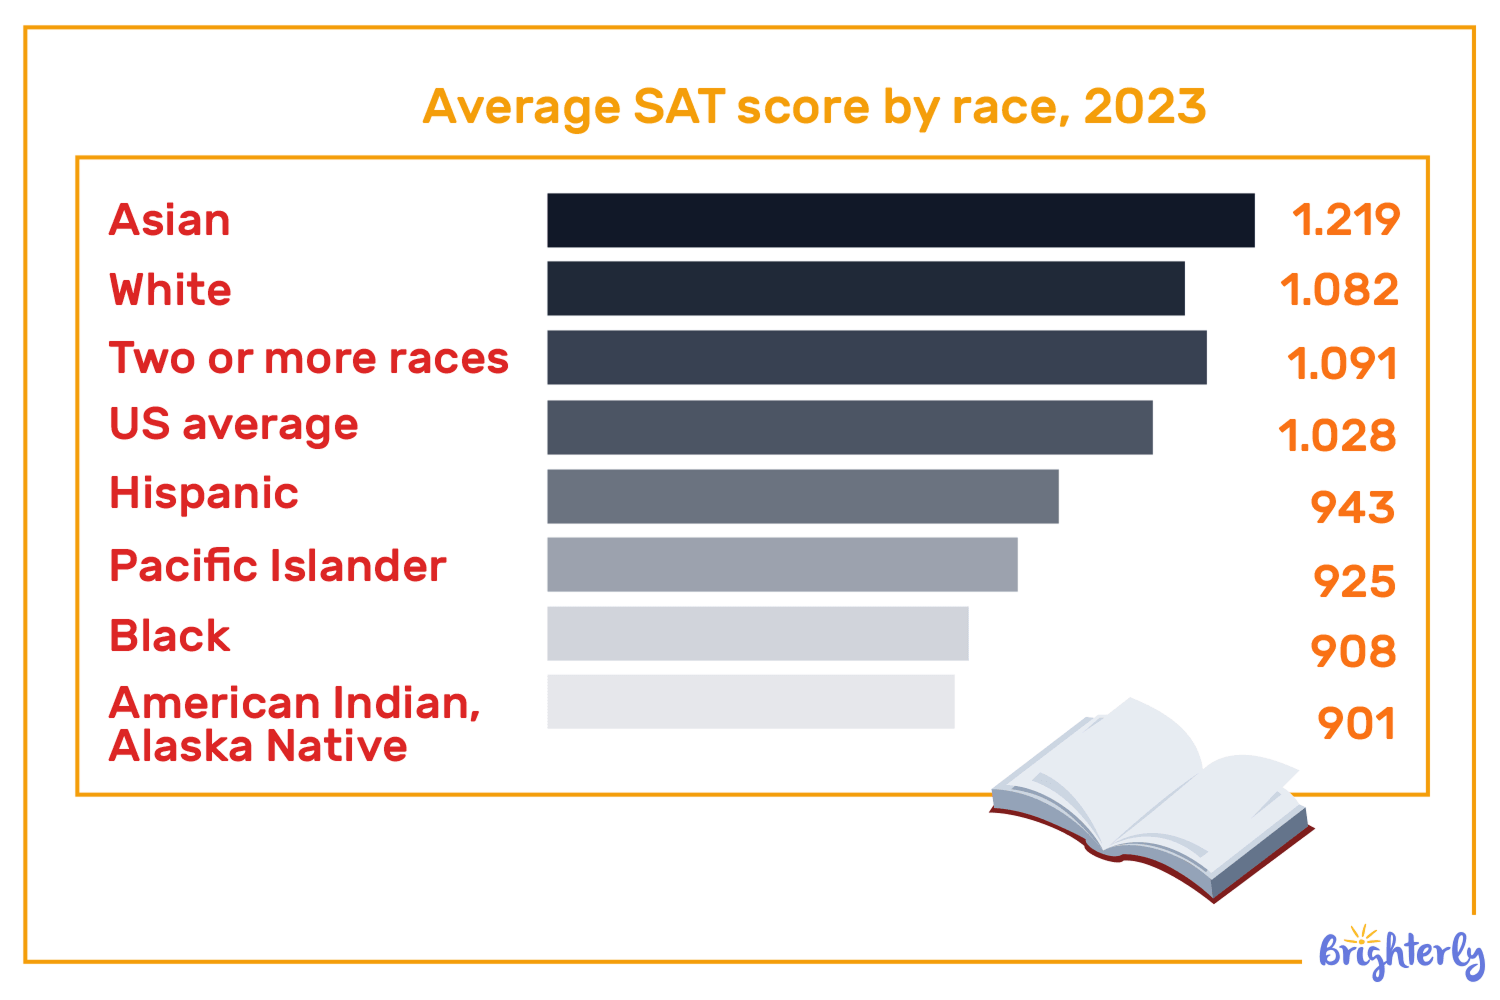
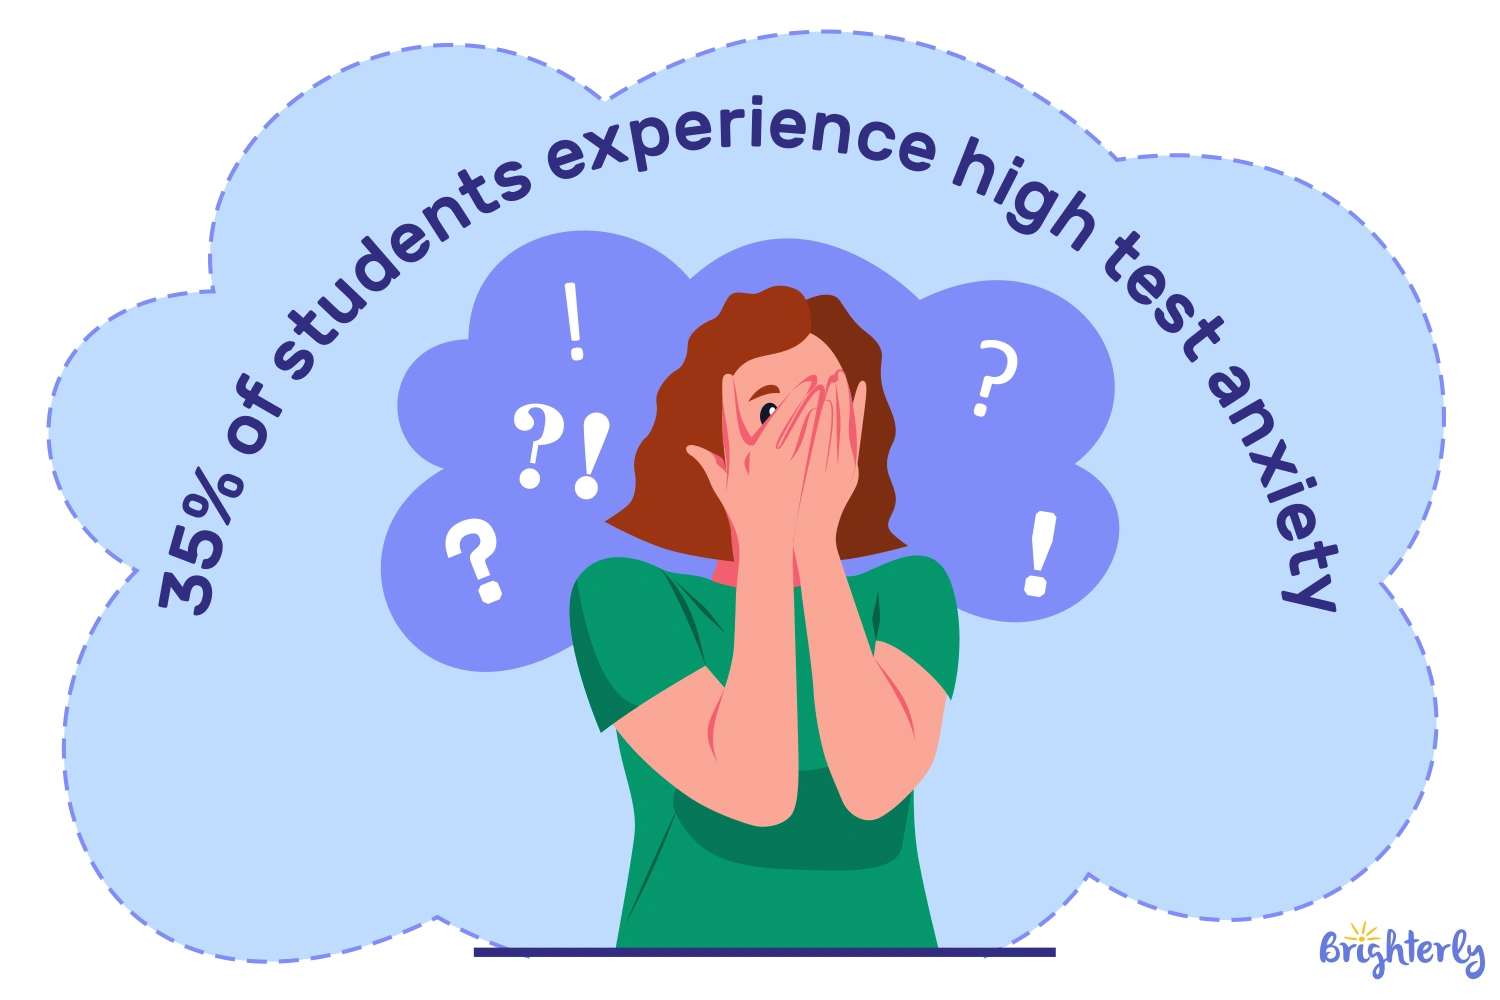
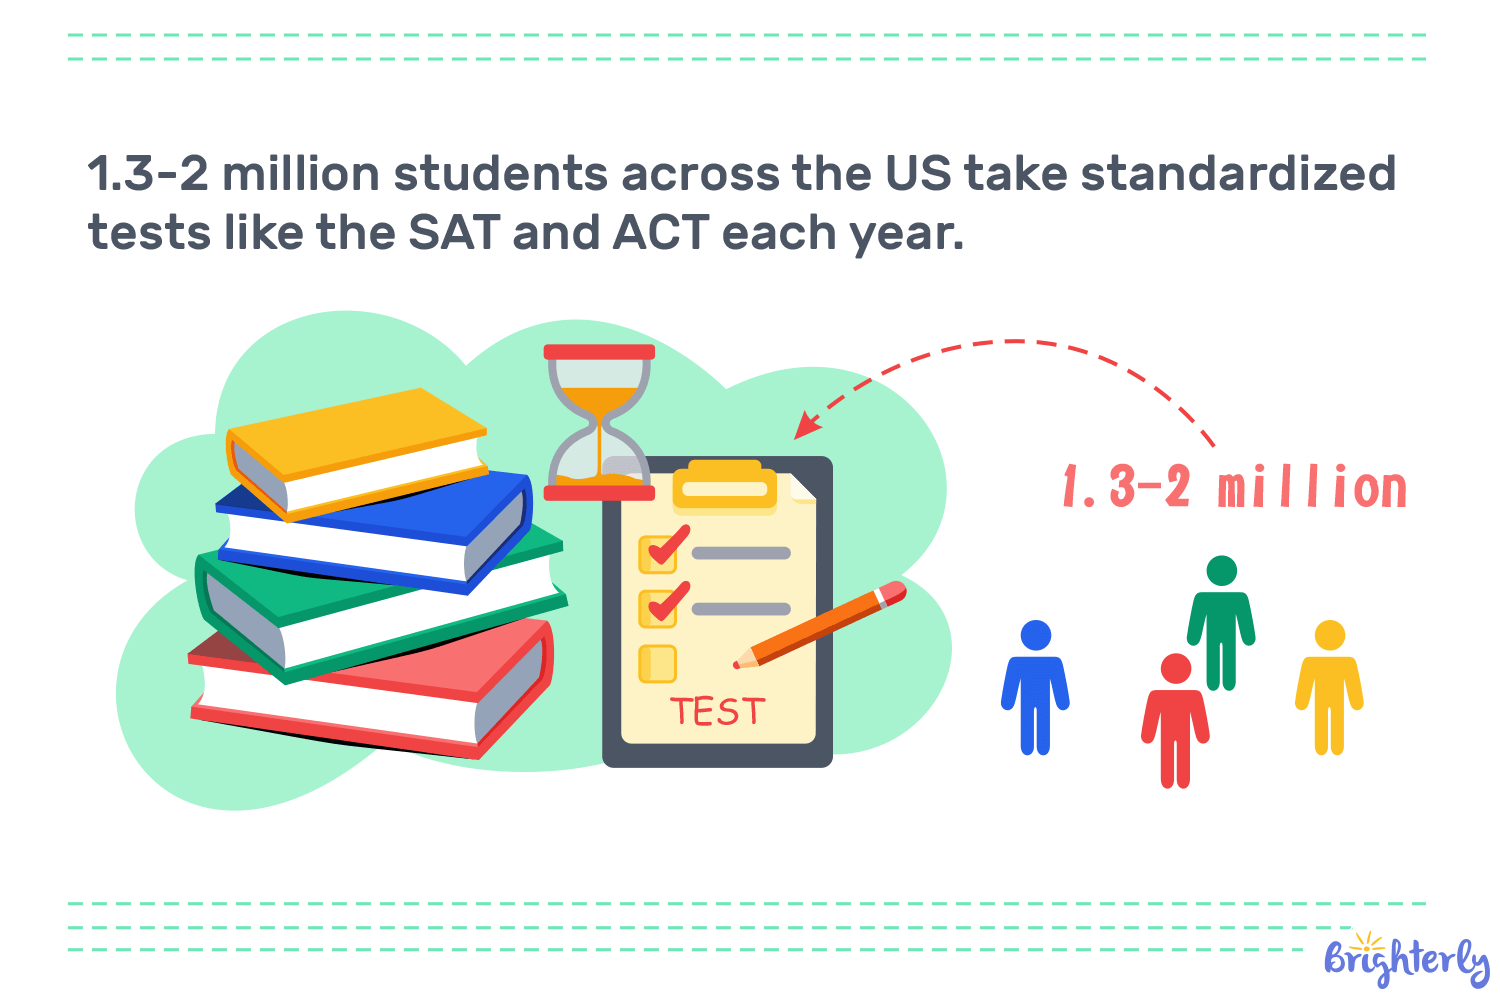
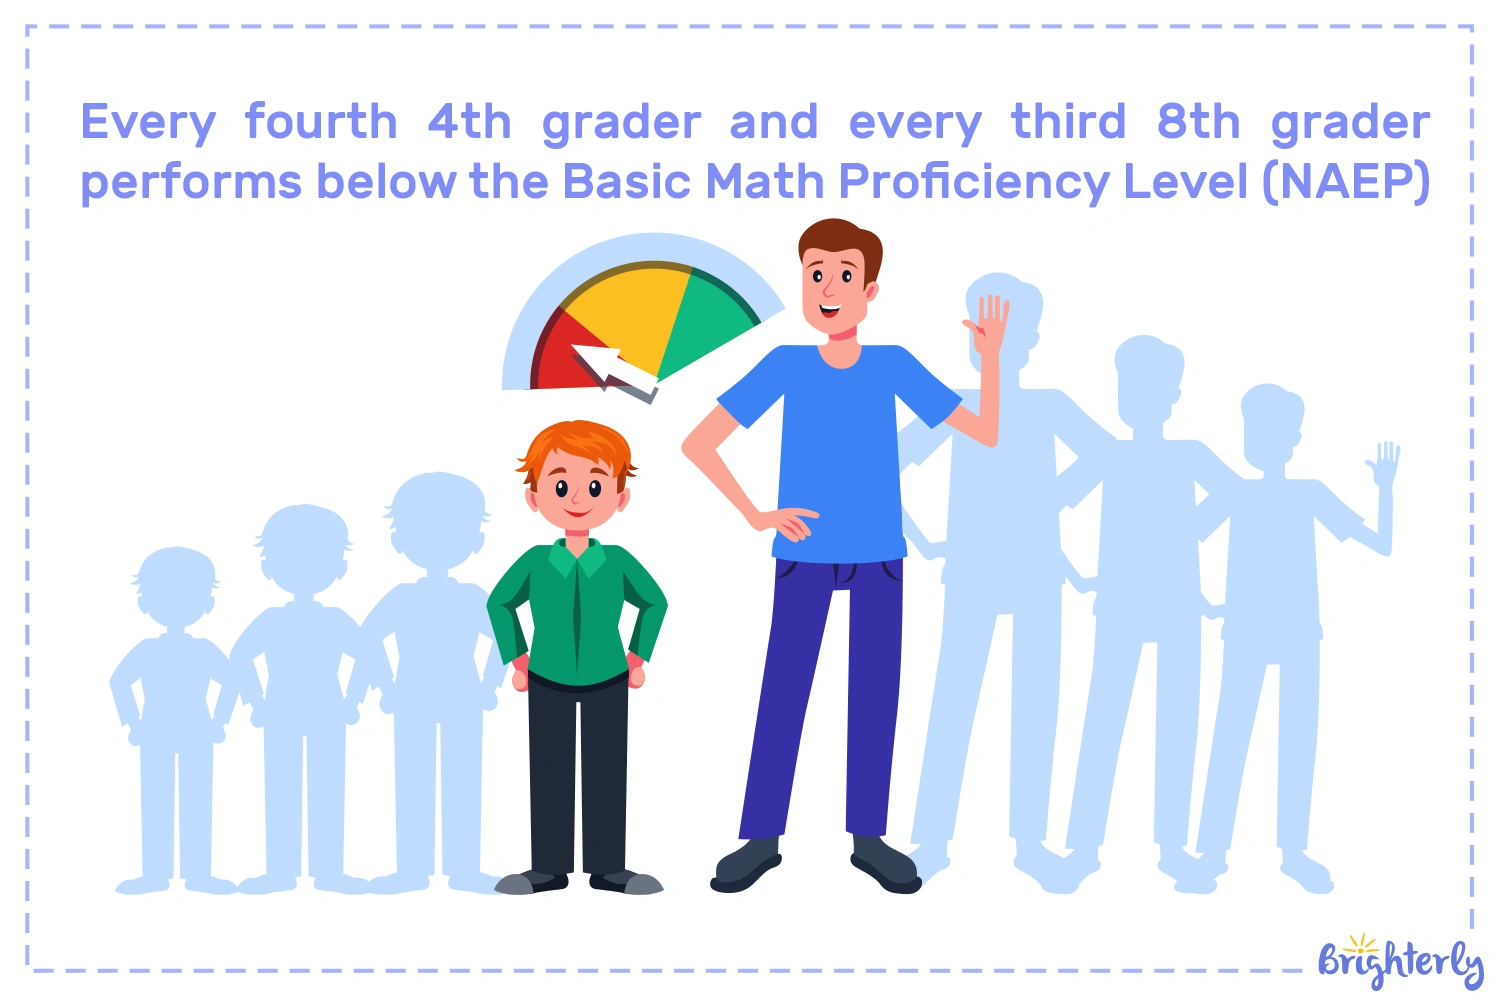
Main Points: Testing stats indicate a slow and uneven recovery after COVID-19, as the participation increases, but scores remain low. Globally, standardized testing appears to be a major tool to assess students’ knowledge, with 800K+ taking tests each year. The US is no exception, having a long history of standardized testing, with its debates, pros, and cons. Standardized tests are types of assessments under which students or test-takers answer the same questions, or questions from a bank, and get a score uniformly. Such tests are a part of the US assessment system and help educators nationwide. What is the purpose of standardized testing? It aims to offer educators the tools to evaluate students’ academic performance objectively and compare their results nationwide. Thanks to a consistent, uniform scoring system, standardized testing collects information about students’ knowledge and skills in selected subjects and shows how schools perform across the country. Geillan Aly, Founder and CEO at Compassionate Math, shares the specifics of how it’s different from a common test: “Standardized exams are written to assess students' performance on a specific exam and get large-scale data about the specific student's performance relative to the others.” For parents, the takeaway is that standardized test scores show how their child performs compared to peers. It may not reveal their individual strengths or demonstrate their real understanding of the subject. Explore Brighterly Learning Experience Learn exactly how Brighterly helps students thrive through expert sessions, online tools, and proven feedback from thousands of satisfied parents Standardized testing statistics 2021-2022 Standardized testing statistics 2023 Standardized testing statistics 2024 Standardized testing statistics 2025 SAT Report 2021: Over 1.5 million students took the SAT, with a math mean score of 528. 49% of students met math college readiness benchmarks. SAT Report 2023: Over 1.91 million students took the SAT, with a math mean score of 508. 42% of students met math college readiness benchmarks. SAT Report 2024: Over 1.97 million students took the SAT, with a math mean score of 505. 41% of students met math college readiness benchmarks. SAT Report 2025: Over 2 million students took the SAT, with a math mean score of 508. 41% of students met math college readiness benchmarks. SAT Report 2021: The Evidence-Based Reading and Writing (ERW) mean score is 533, with 67% of students meeting the college readiness benchmark. 46% of students took the essay. SAT Report 2023: ERW mean score is 520, with 62% of students meeting the college readiness benchmark. 14% of students took the essay. SAT Report 2024: ERW mean score is 519, with 62% of students meeting the college readiness benchmark. 13% of students took the essay. SAT Report 2025: ERW mean score is 521, with 64% of students meeting the college readiness benchmark. 13% of students took the essay. Graduating Class: Over 1.3 million students took the ACT, with a composite score mean of 19.8. 2023 ACT-tested Graduating Class: Over 1.3 million students took the ACT, with a composite score mean of 19.5. 2024 ACT-tested Graduating Class: Over 1.3 million students took the ACT, with a composite score mean of 19.4. 2025 ACT-tested Graduating Class: Over 1.3 million students took the ACT, with a composite score mean of 19.4. Based on the ACT 2021 results, 36% of math and 44% of reading students met the college readiness benchmark. Based on the ACT 2023 results, 30% of math and 40% of reading students met the college readiness benchmark Based on the ACT 2024 results, 29% of math and 40% of reading students met the college readiness benchmark Based on the ACT 2025 results, 29% of math and 39% of reading students met the college readiness benchmark The accuracy of the exams is crucial for admissions and shows the real knowledge, even if the students are at the top of the class. David Blobaum, Co-Founder of Summit Prep, pinpoints the relation between the knowledge and scores: “Although not perfect, the SAT and ACT are very accurate standardized exams..” As the NYC testing results show (2024), some states managed to cover the pandemic math learning loss and even improve it. In the table below, you can see the detailed standardized testing statistics by state. The results are presented for grade 4 and grade 8 students based on the 2024 National Assessment of Educational Progress data and grouped based on state performance: higher, same, or lower than the national public score (NPS) levels. What Is a Standardized Test Statistic by State on Grade 4 Math? What Is a Standardized Test Statistic by State on Grade 8 Math? Based on the 2025 SAT and ACT results, the overall math and reading performance has not dramatically changed after 2024, so you can rely on the data for 2024-2025. “Math and reading gaps aren't the same kind of gap. Reading recovers unevenly; math compounds.” Below, you can see the top 10 states that tested 99%-100% of their students, based on the composite score for the ACT 2025 results: Note that these results are preliminary, and while other states may have higher average ACT composite scores, the percentage of tested graduates is usually lower in such cases. The standardized tests trends of the 2024-2026 period refer to changes in format and time, the role of tests in college admission, post-COVID recovery, and the use of AI. The sharpness of equity and accessibility problems underlines key problems in the U.S. testing data and shows deep social disparities. The data shows the correlation between the academic scores and family income or racial demographics. Considering how the organizations create standardized tests, the early preparation and test-taking skills can be a crucial part in getting a good score. Geillan Aly specifies why the tests are so different and may be challenging: “Standardized tests are written in such a specific style and manner that is unusual for students and is different than how we usually speak.” To further compare the difference, below are two tables on the top 10 states in 2024 based on the US News data. The first shows the ratings based on the proficiency rates for math and reading provided by the 2024 Boston.com post; the other is about underrepresented students, meaning Black, Hispanic, and/or from low-income households. State Number of schools ranked Schools ranked in the top 25 nationally (as of June, 2024) Massachusetts 351 43.9% Connecticut 198 42.9% New Jersey 406 42.1% Maryland 210 39% Florida 647 37.4% Montana 38 36.8% 1,652 35% District of Columbia 33 33.3% New York 1,210 32.1% 334 31.4% State Average proficiency Top school in the state Top school national rank (as of June, 2024) Virginia 68.9% Thomas Jefferson High School for Science and Technology 14 58.1% Greely High School 566 Mississippi 52.3% Ocean Springs High School 682 New York 50% Queens High School for the Sciences at York College 25 Iowa 48% West Senior High School 626 46.4% Julia R. Masterman Secondary School 4 Texas 43.6% The School for the Talented and Gifted 6 43.4% Connecticut IB Academy 117 40% D’Evelyn Junior/Senior High School Massachusetts 39.4% Boston Latin School 27 Standardized testing is good as it allows predicting the performance of students, objectively evaluating their knowledge and skills on a large scale. With a predictable schedule of tests, students can plan their effort and get more control over their education. On the other hand, with objective assessment and hard data, the education system can clearly see the situation with academic performance nationwide. That way, do standardized tests improve education? Yes, to some degree, supporting practice, prediction, and exam preparation. According to the 2024 post by Thomas B. Fordham Institute, they help with grade inflation, while other reasons refer to: Source: Center for American Progress The studies on standardized testing indicate such recurring issues as falling scores, doubts from educators, poor format, and demographic gaps that negatively affect evaluation, the educational system, and the evaluation of kids. Here’s what Nicholas LaPoma, Founder at Curvebreakers, says about the testing ability and its role in testing. “There are many students who know most of the concepts and rules on a test like the SAT, but cannot apply those rules in the various tricky ways presented on a standardized test.” Besides, long testing sessions are not for students who struggle to focus. Is standardized testing effective in this regard? It may not be. Their ability to concentrate can determine the score and be a crucial factor in the testing success. It’s another point that Nicholas LaPoma underlines: “Many students are struggling to maintain focus for a long enough period of time to perform well on standardized tests.” Racial disparities are the most illustrative statistics about standardized testing being bad. Based on the 2023 standardized test statistic from the National Center for Education Statistics, Asian and White students demonstrate better average SAT scores than other races year by year, from 2017 to 2023. Note. According to a 2018 article by The Washington Post, one of the solutions critics provided is project-based learning, yet, in reality, it appears problematic for teachers and students. The negative effects of the standardized testing relate to the development of anxiety among students; the existing test score gap affecting opportunities; significant pressure; and the rise of teaching to the test practices. It comes in line with the main disadvantages of test-taking and may even be a direct outcome of them. Here’s what LaTonya Tuener, a transformational educator, shares on how parents can prevent students from seeing the test as pressure or barriers: “As both an educator and a mother, I learned how essential it is to pair academic skill-building with emotional and physiological support.” Students often reveal test anxiety through consistent patterns, rushing, leaving answers incomplete, or performing far below their daily classwork. When my son Naeem experienced severe test anxiety as a college freshman, my husband and I helped him build a structured Academic Success Strategy. With intentional support, students stop seeing tests as barriers and begin viewing them as opportunities to demonstrate what they know. In regard to teachers, the accountability pressures appear to push them to narrow instruction to tested content and teach to the test. The 2025 article by Lluis Parcerisa on the sense of testing shares the experience of teachers from Madrid, Spain, underlining that teachers “waste time” on preparing for tests rather than using it to support students’ growth. Statistics on standardized testing in the United States of America say that around 1.3-2 million students across the US take standardized tests like the SAT and ACT each year. Based on the SAT Suite of Assessment Annual Report data, 1.9 million students took the SAT in 2024, and over 2 million students took standardized tests in 2025. Based on official US standardized testing information, the average time to pass one standardized test is around 2-3 hours: Note: After the NCLB was implemented, 23 states expanded their assessment programs to meet federal law requirements and introduce tests for grades that were not previously assessed. Since then, NAEP and the Council of Chief State School Officers (CCSSO) were formed, helping some schools cover the gap in standardizing tests and implementing them. The percentage depends on what is considered a struggle, as based on 2024 NAEP Results, only 39% of 4th-grade students and 28% of 8th-grade students performed at or above the Proficient Level. 24% of 4th and 39% of 8th graders performed below the Basic Level. The 2025 SAT assessment showed that, although the test participation is steadily recovering to pre-pandemic levels, as in 2024, only 39% of standardized test takers met or exceeded readiness benchmarks in the Evidence-Based Reading and Writing and Math.
Help your kid hit the benchmark
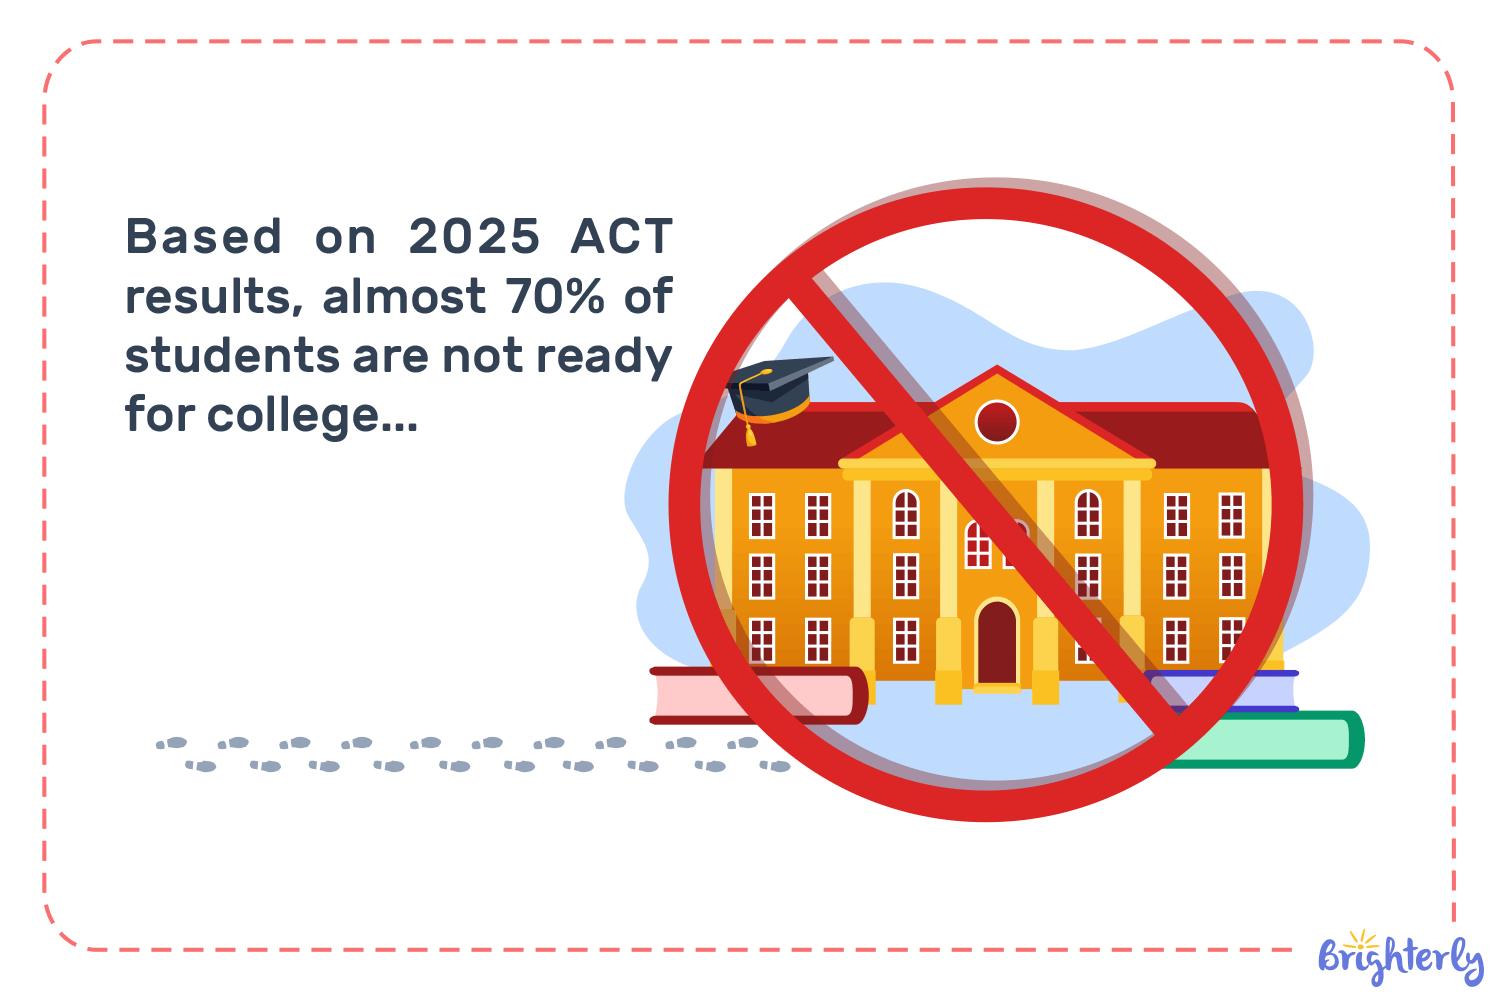
Our tutors help close gaps and target exactly what the tests expose In 2024 and 2025, the 19.4 average ACT composite score became the lowest in over 30 years. Only 30% of graduates met three or four ACT’s readiness benchmarks for colleges (English, math, reading, science), and only 57% met at least one benchmark. To help your child prepare for the standardized test, you and your child should identify gaps, set expectations, focus on materials, and test knowledge skills. You can do it together or resort to professional help. Nicholas LaPoma underlines that reflecting on weaknesses on a test and targeting them is the most effective strategy: “The most effective strategy to feel prepared and confident for standardized tests involves taking a diagnostic test to establish a baseline score.” At Brighterly, a math and reading tutoring platform, we focus on customizing each session to the students’ needs, whether it’s a phonics issue, reading comprehension, or test prep in high school. In particular, to help students prepare and gain confidence, our tutors follow such an approach: With such an approach, we try to make sure kids not only practice the areas that need improvement but also gain confidence and cope with pressure.
Help your child reach their full potential!
Answer a few quick questions about your child’s learning for personalized next steps. Students often take around 1-2 tests per subject each quarter or semester. Considering this, the students in grades 3-8 will take up to 10 standardized tests per year. Such a figure comes from requirements and policies set in the state for math and English tests. High school students often have even more, as they also take the SAT, ACT, AP, or state end-of-course exams. There’s no such thing as a pass mark, yet around one-third of fourth and eighth-graders score at or above “proficiency” in reading and math (NAEP, 2024). In particular, about 39% of fourth graders score at or above the particular level in math, while for fourth and eighth graders, the percentage for reading is 30-31%. At the same time, according to the 2025 Education Next research, the average for proficient and advanced marks is around 50% for both math and reading for the eighth graders. A standardized test score in statistics is a number that demonstrates the students’ performance on a unified scale to evaluate and compare it with others in a defined population. To get a standardized test score, the evaluators convert the number of correct answers or points earned into a standard score value. Yes, they standardized test scores have the power to predict academic success, but they are not the sole predictor, as GPA, coursework activity, and study habits do matter as well. Higher scores of a student reflect their higher level of knowledge and skill. SAT and score seem to forecast the academic performance of first-year students. For instance, the research by John Friedman on academic performance at Ivy-Plus colleges underlines that students with the highest scores on tests usually have 0.4 points higher first-year GPA than those with a score of 1200 on the SAT. Standardized test scores have changed since COVID-19. The scores fell in 2021 and 2022 and have not recovered in 2025. In particular, SAT math scores dropped from 49% to 41%, while ACT scores dropped from 19.8 in 2022 to 19.4 in 2025. It goes in line with the college readiness benchmark. In 2021, 36% of math and 44% of reading students who took the ACT test met this mark, and in 2025, only 29% and 39%, respectively. Massachusetts is at the top of most of the national rankings, as almost 44% of its ranked schools are in the top 25% of the U.S. for math and reading proficiency. Moreover, it is in the NAEP math tables together with New Jersey and Connecticut. If taking into consideration states testing 99-100% of graduates with the ACT, Nebraska and Wyoming are at the top with 19.2 and 19.1 points on average. Outschool draws mixed-to-positive reviews from parents and educators, with plenty of praise for its huge variety of engaging enrichment classes alongside real criticism of inconsistent teacher quality and billing frustrations. This review breaks down what parents actually say, where Outschool shines, and where it tends to fall short. Scoring Methodology: This overview checks Outschool under […] May 12, 2025 Average of all Varsity Tutors ratings: 7.2/10. Wonder why Varsity Tutors, a popular tutoring platform, has so many mixed reviews? The reason may be in its coverage, tutors’ quality, and the algorithm behind the platform’s work. This guide aims to evaluate Varsity Tutors based on 5 criteria, underline its pros and cons, and delve deeper […] May 15, 2025
What Are Standardized Tests? Definition and Purpose


Statistics About Standardized Testing in the US (2021-2025)

Key Points from National Standardized Testing Statistics
Standardized Testing Statistics by State (2024-2025)
Did Standardized Tests Statistics by State Change in 2025?

Standardized Testing Trends (2024-2026)
Statistics of Standardized Testing by School: Social Disparities
Top 10 States Based on Math and Reading Test Scores (All Students)
California
Colorado
Top 10 States Based on Math and Reading Test Scores (Underrepresented Students) (as of 2024)
Maine
Pennsylvania
Connecticut
Colorado
59
Why Standardized Testing Is Good (Statistics)
Statistics on Why Standardized Testing Is Bad
 The obvious reasons are:

Negative Effects of Standardized Testing on Students
Test-Taking Anxiety
Additional Pressure

Focus on Test Taking, Not Teaching Concepts
How Many Students Take Standardized Tests Each Year?
How Much Does It Take to Pass Some Standardized Tests in the United States?
Key Facts About Standardized Testing
What Percentage of Students Struggle With Standardized Tests?


How to Help Your Child Prepare for Standardized Tests
Frequently Asked Questions
How Often Do Students Take Standardized Tests Each Year?
What Percentage of Students Pass Standardized Tests?
What Is a Standardized Test Score in Statistics?
Do Standardized Test Scores Predict Academic Success?
How Have Standardized Test Scores Changed Since COVID-19?
Which States Perform Best on Standardized Tests?




Math & reading from 1st to 12th grade
Looking for homework support for your child?

Choose kid's grade

Math & Reading for Grades 1–12
Build real confidence for your child with a Brighterly math or reading tutor.