Summer Slide Statistics 2026
reviewed by Franz Jerby Delos Santos
Updated on August 21, 2025

Summer arrives, bringing a summer learning slide with it. You may believe it or not, but you should do something with it. Yet, the question remains, “Is it severe enough to even worry?” For an answer, here are key summer slide statistics to help you see the complete picture and use it to your advantage.
Key summer slide stats:
- COVID-19 accelerated and worsened the summer slide, which on average affects up to 78% of students.
- Math summer loss is usually greater than reading loss (1-3 months compared to 1-2 months).
- Summer slide has a cumulative effect. If not addressed promptly, it can worsen academic performance up to 3 years of lag and cause mental health issues.
- Math tutoring and regular reading during the summer are the easiest and most effective strategies to minimize the summer slide effect.
Summer slide statistics in the US [2018-2021]
![Summer slide statistics in the US [2018-2021]](https://brighterly-stage.xyz/wp-content/uploads/2025/07/Summer-Slide_1-1024x614.png)
Summer slide is usually defined by comparing a standardized testing score before and after the summer learning break, as a loss in academic skills and knowledge. Below you can find key summer slide statistics prior to and during COVID (2018-2021).
Summer slide statistics 2018 |
Summer slide statistics 2019 |
Summer slide statistics 2020 |
Summer slide statistics 2021 |
| On average, English language summer loss is between 17% and 28% of information gained during the previous school year (data for 2016-2017, SageJournals) | Summer slide is more complex than just socioeconomic status and is not inevitable. Data shows that 22% to 38% of 3.4 million NWEA MAP Growth assessment students gained during summer. | Summer loss has a cumulative effect and affects 52% of students, based on the analysis of 200 million test scores for around 18 million students (SageJournals) | Isolation during the pandemic caused an average 0.4-year loss of math education by the end of 2021. Only 37% of math losses were recovered by the end of 2022. |
| The average math student loses between 25% and 34% of the gains they make during the school year over the summer (data for 2016-2017, SageJournals) | Students’ volume of knowledge gained during the previous school year impacts summer slide more than race/ethnicity (22 and 39% explanation to only 1%) | On average, the reading loss during summer equals 1-2 months and can increase even more after the pandemic | Losses in reading are 2 ISIP points in K-1 and 30-40 ISIP points for grades 3-5. In math, the loss is 25-37 ISIP points across grades K-5. |
| Children from poor households receive less regular care from someone other than their parents (83% compared to 70% non-poor ones) | Access to summer programs, length of the school year, and test disengagement after summer can be other possible explanations for summer slide | On average, the math loss during summer equals 2-3 months and can increase even more after the pandemic | COVID-19 has worsened the summer slide, as it has become an integral part of overall learning loss |
As the 2018-2022 data shows, summer slide numbers indicate it’s a severe and massive problem. However, there was confusion about whether factors like socioeconomic status and access to summer activities have a real effect on it.
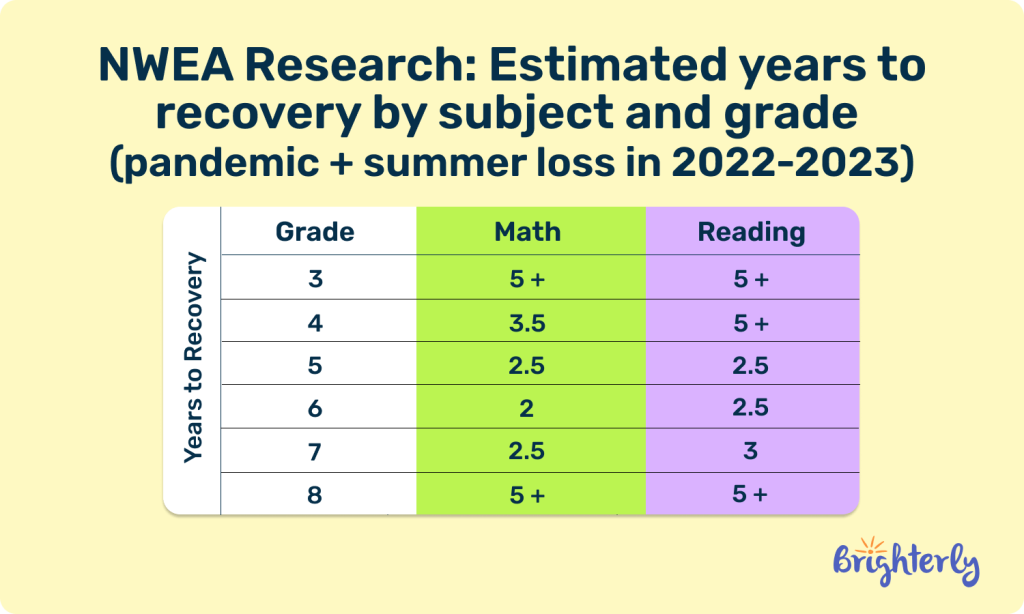
What are the statistics on the summer slide in the US? [2022-2025]
During 2022-2025, the summer slide statistics graph in the US show that the summer slide, due to its cumulative effect that was multiplied by the pandemic learning loss, can cause up to 3 years of lagging behind peers. Also, it has a more dramatic effect on math than on reading.
![What are the statistics on the summer slide in the US? [2022-2025]](https://brighterly-stage.xyz/wp-content/uploads/2025/07/Summer-Slide_2-1024x614.png)
Source: NWEA research, 2024
The summer reading slide statistics graph shows that the practice of reading during the summer slows down the summer slide and supports future academic success.
Summer slide statistics 2022 |
Summer slide statistics 2023 |
Summer slide statistics 2024 |
Summer slide statistics 2026 |
| By 5th grade, students may have lost 1.5 years (18 months) of learning. |
On the NWEA tests, children lost between 0.3 and 0.5 standard deviations (SD) over the summers, an amount equivalent to 2 to 3 months of school-year learning. |
On the NWEA tests, reading gaps increased by 36% during 2023-2024 and math gaps increased by 18%. | A cumulative effect of summer loss is still evident: by 5th grade, students can lag behind by 2.5-3 years. |
| Math loss increases grade by grade, with grade 6-7 students losing 30–40% of their school-year gains. | Summer slide is still affected by the pandemic loss, which equaled 0.17 grade levels in math learning loss between 2023 and 2024. | Summer programs are among the most popular strategies to combat summer slide by state schools; thus, $5.8 billion of ESSER funding is expected to be spent by fall 2024. | Annually, summer slide can cause up to 300 hours of learning loss (Zipdo Education Report 2026). |
| Summer loss is around 10-20% compared to the previous year’s gains. The higher the grade, the higher the average loss is. |
Test results differ: in reading, between the fall of kindergarten and the spring of second grade, the SD grew by 38% on the NWEA test but shrank by 25% on the ECLS-K:2011 test. |
The Progress Learning survey of around 1000 teachers showed that 63.6% of educators agreed that summer slide exists. Only 31.3% believed their students were not affected by it. | Summer programs may cut summer slide in math by 50% among high attenders (Zipdo Education Report 2026). |
After COVID-19 and with more summer slide research on a nationwide level, the pattern of losing knowledge during summer break has become even more striking. While some researchers still question the phenomenon of “summer slide,” some loss (be that knowledge gap or curricular learning break) is still evident.
At the same time, all the attempts to find a reliable correlation between races, genders, ages, and summer slide assessments have received mixed evidence in the research. Also, researchers struggle to see the effect of summer slide in separation from post-pandemic learning loss, which is still not fully covered in 2026.
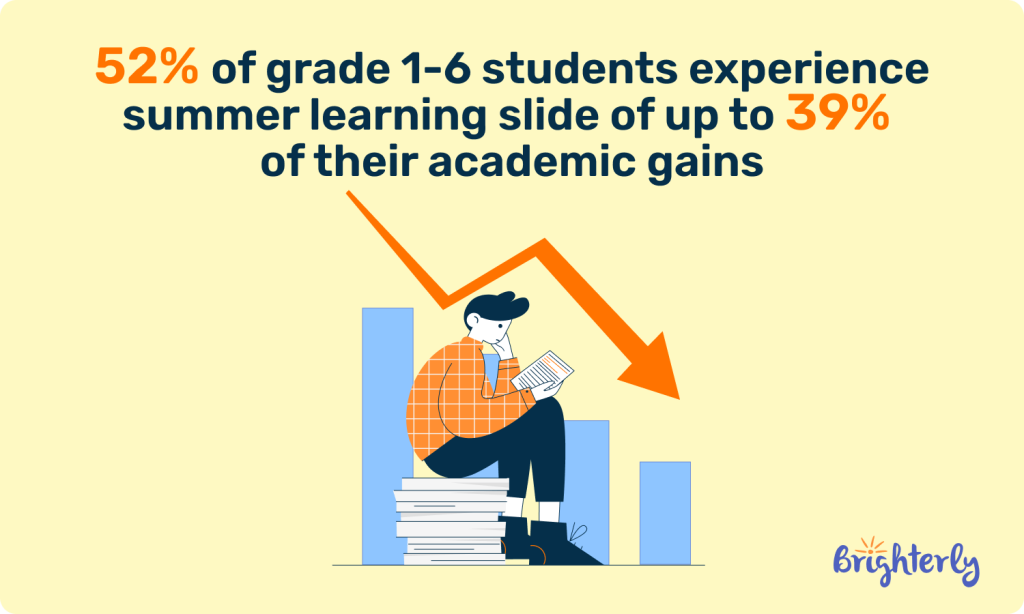
What is the summer slide percentage?
The largest national study on summer slide statistics from 2018 to 2026 found that 52% of first through sixth graders experienced summer learning slide, which is the loss of an average of 39% of their total school-year gains over the course of each summer.
Reading and math summer slide statistics
On average, the statistics on math summer loss is greater than reading loss in all the years of observation. But the exact difference in loss varies by state, grade, and subject. Thus, the data in the table shows raw averages based on the studies with the greatest samples.
Year |
Summer reading slide statistics |
Math summer slide statistics |
Notes |
| 2018-2021 | 17-28% loss (1-2 months) | 25-34% (2-3 months) | Socioeconomic status has a significant impact on research data |
| 2022-2024 | Up to 1.5 years | 2-3 months | The dramatic negative effect is combined with pandemic learning loss |
| 2025 | Up to 3 years cumulatively | Up to 300 hours annually | Access to the summer programs and activities shows more effect on summer slide than other factors |
How much information do students lose over the summer?
Based on the summer reading slide statistics, students can lose 1-2 months of reading skills.
Additionally, math summer slide statistics show that students can lose 1-3 months of math skills due to summer slide, with 70-78% of students can be affected by this problem.
The research doesn’t provide unified data on who is affected more by the summer break:
- Some say, elementary students tend to lose more knowledge as they have basic skills that are hard to acquire and easier to lose
- Some researchers found that middle-grade students reveal a cumulative effect of learning slide that can equal several months.
- High graders can be affected by summer slide up to several years lagging behind peers, since their knowledge gains are generally greater when lost proportionally and cumulatively among all age groups.
How to beat the summer slide?
Based on the summer slide statistics, the best way to beat the summer slide is to find a way for your kid to keep learning something new every day. In this regard, it’s essential to pay attention to what summer means for your child:
- Are they involved in outdoor activities that teach them how to be human?
- Do they learn things from a different perspective during the summer months?
If your child doesn’t get access to discovering something new about the world every day, most likely, they will experience problems connected with summer slide.
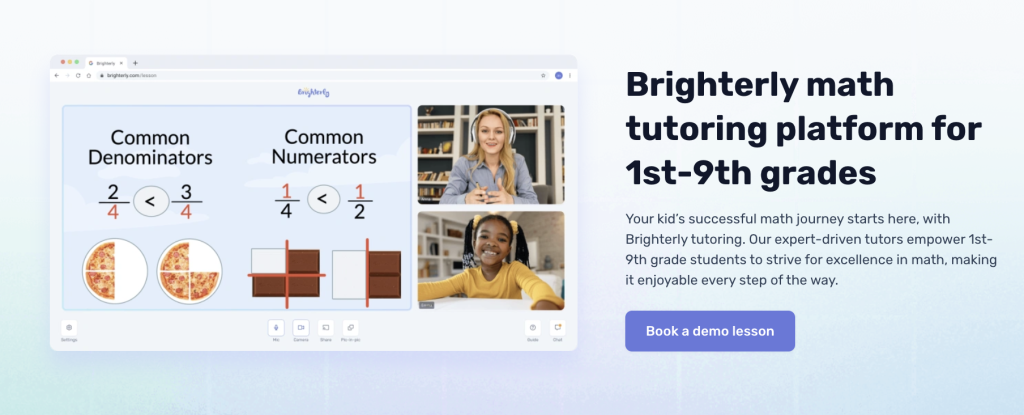
How Brighterly reading and math tutors help your kid cover summer slide
Summer slide can be a golden window to catch up with, and Brighterly reading and math tutors can help your child stop losing and start gaining knowledge during summer. The best part of these tutoring programs? They don’t even feel like studying, which is perfect when we want every summer to feel like freedom.
Brighterly reading program stands out for its highly personalized 1:1 teaching approach, tailored to the child’s needs, progress, and learning style. Based on the summer slide in reading statistics, the summer reading practice is a good tool to stop summer slide. But if your kid feels some challenges to start doing this, that’s where Brighterly tutoring support can reveal its best.
The Brighterly math program also adopts a customized teaching approach that is adapted to kids’ needs. Since math summer slide statistics demonstrate that children experience more problems and frustration with this subject after summer break, the lessons are built to be easy, genuinely enjoyable, yet effective.
Both programs start with a free demo lesson, so just click the button in the banner below and try them both!
Free reading and math materials you can get from Brighterly right now:
- Reading and math class diagnostic tests to help check knowledge and detect learning deficiency areas.
- Reading and math worksheets with engaging, targeted practices that cover the most common problem areas.
- Free first lesson with 1:1 personalized tutoring from Brighterly. After that, you can start regular tutoring at an affordable price from $17.40/lesson for deeper practice and better results.
If your kid needs to catch up but fails with it year after year, math tutoring during summer break is the perfect option for you. It’s the most universal, targeted, and effective method among various ways to prevent summer slide for your child.


Check the basics behind this term
Take our quick quiz to discover the perfect learning solution based on your child’s needs.
What are the statistics on the summer slide by state?
Due to the lack of a comprehensive, comparable data system in the majority of states, statistics on the summer slide by state are insufficient. However, the summer program initiatives from nine US states have reportedly shown some positive results.
Based on the report, Georgia, Louisiana, Massachusetts, Michigan, New Mexico, Oregon,
Tennessee, Texas, and Vermont have adopted five key strategies to effectively address summer learning slide:
- Garnering support for summer learning investments
- Implementing state grant programs for summer learning
- Increasing access for priority groups
- Promoting high-quality programming
- Collecting and using data
These strategic initiatives demonstrate a good track record in both student participation and their academic recovery. By supporting both school districts (LEAs) and community-based organizations (CBOs), these states managed to target the right audience with their focused initiatives to have positive results.
Summer slide statistics: Details
Notwithstanding the attempts of researchers to analyze summer slide in connection with certain factors (like grade, low income, or race), they fail to find a strong theoretical correlation. However, in practice, some states’ educational initiatives that give low-performing students from low-income families priority have produced favorable outcomes.
On a state level, summer slide reading statistics were improved by collecting all the sufficient data to check the results and hiring certified teachers, using high-quality curriculum, and ensuring sufficient program duration and attendance.
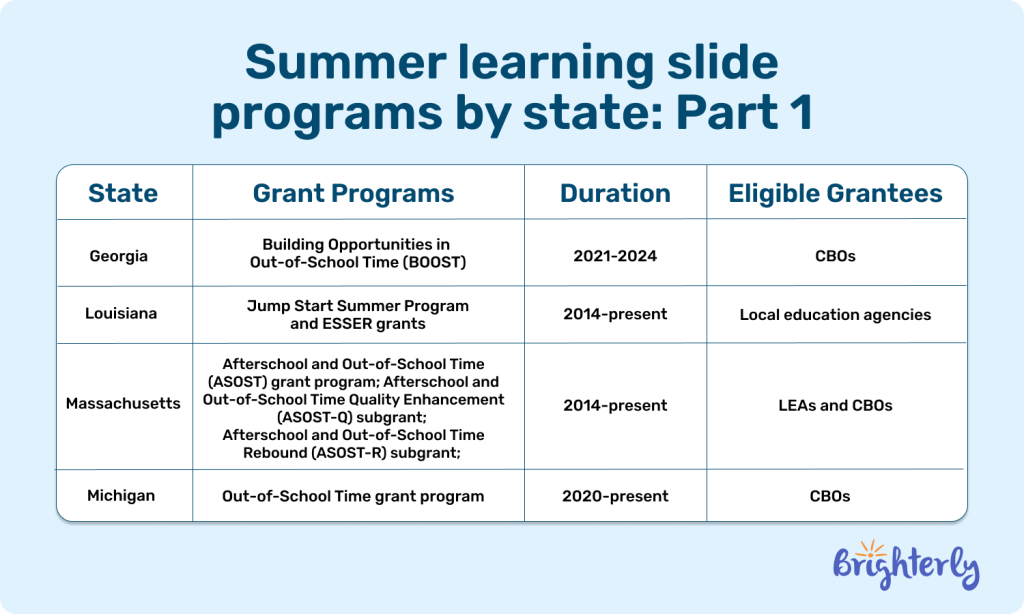
Summer learning slide programs by state: Part 1
Summer learning slide programs by state: Part 2
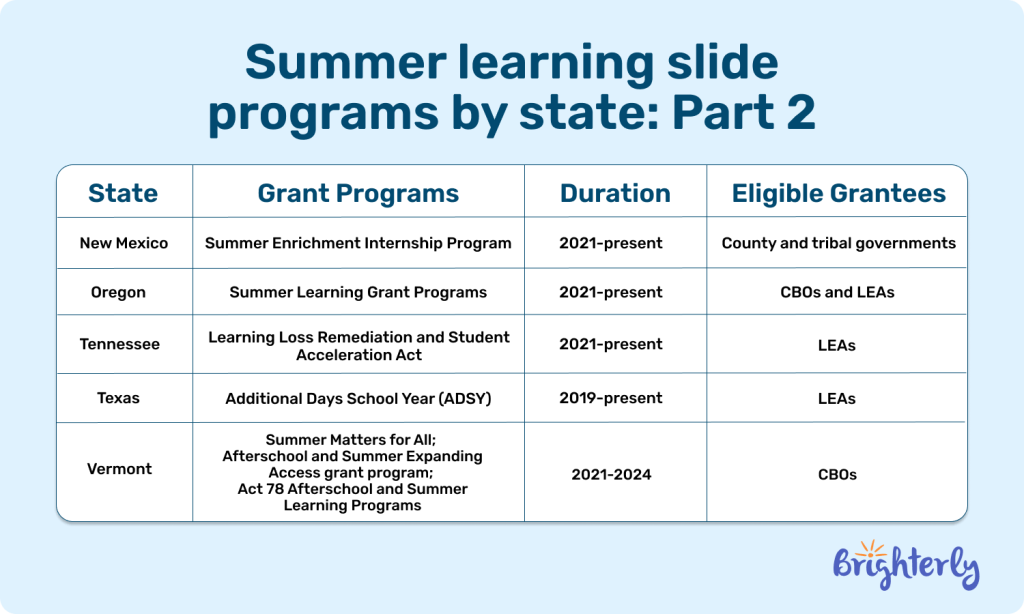
Source: Learning Policy Institute Report, 2026
What are the effects of the summer slide?
As summer slide research shows, the most prominent effects of the summer slide are cumulative academic performance losses and mental health problems.
Source: NWEA Research, 2022
Academic performance
As kids can lose 1-3 months of reading and math skills during the break, each new school year starts with your child behind where they left off. The cumulative effect of summer slide, combined with the pandemic learning loss, can cost your child years of learning.
Mental health problems
Considering that summer slide can make children perform dramatically lower, they are likely to develop stress, anxiety, and depression issues because of that. Next, these problems can lead to even more complex consequences, like sleep deprivation, lost appetite, low energy level, mood swings, and even withdrawal from family and school.
That’s why it’s so important to timely detect and prevent possible negative effects connected with summer slide.
Summer slide statistics: Conclusion
The importance of summer reading statistics is hard to underestimate, considering that summer break can cost your child several months or even years of studying. At the same time, it’s also true that summer slide is heavily marketed and usually not that dramatic. Even though the data on summer slide is not sufficient, it has surely gained sufficient coverage to be considered seriously by parents and educators.
Most likely, the truth is somewhere in the middle: it’s essential to keep your kid engaged in learning something new every summer and get them nice books they can read with love. And one of the best ways to support their motivation throughout the whole summer is to find your kid a learning tutor and a reading companion for this season.
If you feel your kid needs support to catch up during summer, the Brighterly reading and math tutoring platform offers several tools to make it happen. Try a free lesson with a tutor and use free diagnostic materials on the website to find the most appropriate — and fun! — tool for your kid’s summer knowledge and skills achievement.
In the end, summer is not an enemy. It’s a perfect season to learn something new diversely. Book the first free lesson with Brighterly so that reading and math tutors can show your kids this different way.


If you are currently subscribed to Varsity Tutors, but you find that it is not improving your child’s grades, you’re most likely searching for the answers to how to cancel Varsity Tutors. As a tutor with years of experience, I understand parents’ frustrations with learning programs that just don’t work. Here, I will be taking […]

Jul 02, 2025
As a homeschooling parent, are you choosing between Miacademy vs Time4Learning vs Brighterly? I’m using my teacher expertise to review the three platforms and show you which one works best for your particular situation. I’ll make sure to highlight the main features as well as the pros and cons of each. Key points Brighterly is […]

Jul 07, 2025
Math & reading from 1st to 9th grade
Looking for homework support for your child?

Choose kid's grade
Math & Reading for Grades 1–9
Build real confidence for your child with a Brighterly math or reading tutor.